The BARPLOT function plots data as a series of rectangular bars.
Example
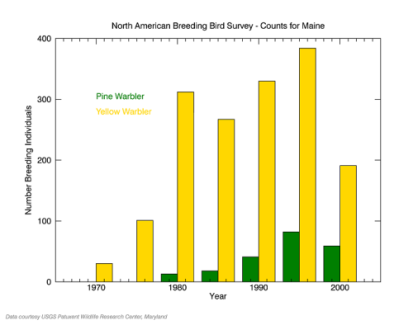
The following lines create the plot shown.
Pine_Warbler = [0, 0, 13, 18, 41, 82, 59]
Yellow_Warbler = [30, 101, 312, 267, 330, 384, 191]
Year = [1970, 1975, 1980, 1985, 1990, 1995, 2000]
b1 = BARPLOT(Year, Pine_Warbler, INDEX=0, NBARS=2, $
FILL_COLOR='green', YRANGE=[0, 400], YMINOR=0, $
YTITLE='Number Breeding Individuals', XTITLE='Year', $
TITLE = 'North American Breeding Bird Survey - ' + $
'Counts for Maine')
b2 = BARPLOT(Year, Yellow_Warbler, INDEX=1, NBARS=2, $
FILL_COLOR='gold', /OVERPLOT)
text_pine = TEXT(1970, 300, 'Pine Warbler', /CURRENT, $
COLOR='green', /DATA)
text_yel = TEXT(1970, 275, 'Yellow Warbler', /CURRENT, $
COLOR = 'gold', /DATA)
text_note = TEXT(11, 12, 'Data courtesy USGS Patuxent ' + $
'Wildlife Research Center, Maryland', /CURRENT, $
COLOR='gray', FONT_SIZE=8, FONT_STYLE=2, $
TRANSPARENCY=20, /DEVICE)
Additional Examples
See Barplot examples for additional examples using the BARPLOT function.
Syntax
graphic = BARPLOT([Locations], Values, [, Keywords=value] [, Properties=value])
Keywords
Keywords are applied only during the initial creation of the graphic.
AXIS_STYLE=value
/BUFFER, /CURRENT, /DEVICE, DIMENSIONS=[width, height], DRAG_QUALITY=quality, LAYOUT=array, LOCATION=[x, y], MARGIN=scalar or [left, bottom, right, top], /NO_TOOLBAR, /NODATA, /OVERPLOT, /WIDGETS
Properties
Properties can be set as keywords to the function during creation, or retrieved or changed using the "." notation after creation.
ANTIALIAS, ASPECT_RATIO,
AXES, BACKGROUND_COLOR,
BACKGROUND_TRANSPARENCY,
BOTTOM_COLOR, BOTTOM_VALUES,
C_RANGE, CLIP, COLOR,
CROSSHAIR,
FILL_COLOR, FONT_COLOR, FONT_NAME, FONT_SIZE, FONT_STYLE,
HIDE, HISTOGRAM, HORIZONTAL, INDEX,
LINESTYLE, NAME,
NBARS, OUTLINE, PATTERN_BITMAP, PATTERN_ORIENTATION, PATTERN_SPACING, PATTERN_THICK, POSITION,
THICK, TITLE,
TRANSPARENCY,
UVALUE, WIDTH,
WINDOW, WINDOW_TITLE,
XRANGE,YRANGE
Methods
Close
ConvertCoord
CopyWindow
Delete
Erase
GenerateCode
GetData
GetValueAtLocation
MapForward
MapInverse
Order
Print
Refresh
Rotate
Save
Scale
Select
SetData
Translate
Return Value
The BARPLOT function returns a reference to the created graphic. Use the returned reference to manipulate the graphic after creation by changing properties or calling methods.
Arguments
Locations
A vector representing the abscissa values to be plotted. If Locations is not specified, Values is plotted as a function of point number (starting at zero). If both arguments are provided, Values is plotted as a function of Locations. If HORIZONTAL is set, these values will be located on the Y axis. If HORIZONTAL is not set (the default), these values will be located on the X axis.
Values
The ordinate data to be plotted. If HORIZONTAL is set, these values will be positioned along the X axis. If HORIZONTAL is not set (the default), these values will be positioned along the Y axis.
Keywords
Keywords are applied only during the initial creation of the graphic.
AXIS_STYLE
Set this keyword to one of the following values:
- 0 - No axes. Decrease the margins so the graphic almost fills the window. This is the default for images.
- 1 - Single X, Y (and Z if 3D) axes located at the minimum data value. The margins will be adjusted to leave space for the axes. This is the default for 3D graphics.
- 2 - Box axes - multiple axes located at both the minimum and maximum data values. The margins will be adjusted to leave space for the axes. This is the default for 2D graphics.
- 3 - Crosshair-style axes - located at the midpoint of each data dimension. Since the axes are in the middle, decrease the margins so the graphic almost fills the window. This is the default for polar plots.
- 4 - No axes, but use the same margins as if axes were there. This is useful if you want to later add another graphic that does have axes, and you want the two visualizations to be aligned properly.
You can set the following properties on the axes:
|
Property |
Description |
|
[XYZ]COLOR |
A string or RGB vector containing the axis color.
|
|
[XYZ]GRIDSTYLE |
A string, integer, or 2-element vector giving the linestyle for tickmarks.
|
|
[XYZ]LOG |
Set to 1 if the axis is logarithmic. The minimum value of the axis range must be greater than zero.
|
|
[XYZ]MAJOR |
The number of major tick marks. Set to -1 to auto-compute, set to 0 to suppress.
|
|
[XYZ]MINOR |
The number of minor tick marks. Set to -1 to auto-compute, set to 0 to suppress.
|
|
[XYZ]SUBGRIDSTYLE
|
A string, integer, or 2-element vector giving the linestyle for the minor tickmarks. The default is 0, for solid lines. Set to -1 to force minor ticks to have the same linestyle as major ticks.
|
|
[XYZ]SHOWTEXT |
Set to 1 to show text labels or 0 to hide the text labels.
|
|
[XYZ]STYLE |
The axis range style. The valid values are:
(0) Nice range. Default for all graphics except Image, Barplot, and Map.
(1) Force the exact data range. Default for Image, Barplot, and Map.
(2) Pad the axes slightly beyond the nice range.
(3) Pad the axes slightly beyond the exact data range.
The [XYZ]RANGE takes precedence over this property.
|
|
[XYZ]SUBTICKLEN |
The ratio of the minor tick length to the major tick length. The default is 0.5.
|
|
[XYZ]TEXT_COLOR |
A string or RGB vector containing the axis text color.
|
|
[XYZ]TEXT_ORIENTATION
|
The angle (in degrees) of the tick mark labels.
|
|
[XYZ]TEXTPOS |
Set to 1 to position text above the axis. The default is 0, below the axis.
|
|
[XYZ]THICK |
Set to a floating-point value between 0 and 10 to specify the line thickness for tickmarks. A thickness of 0 gives a thin hairline. The default is 1.
|
|
[XYZ]TICKDIR |
Set to 1 to draw the tickmarks facing outwards. The default is 0, facing inwards.
|
|
[XYZ]TICKFONT_NAME
|
A string containing the font name for the axis text.
|
|
[XYZ]TICKFONT_SIZE
|
The axis text size in points.
|
|
[XYZ]TICKFONT_STYLE
|
A string or integer containing the font style: normal (0), bold (1), italic (2), or bold italic (3).
|
|
[XYZ]TICKFORMAT |
A string or string array of tick label formats. See Format Codes for more information.
|
|
[XYZ]TICKINTERVAL
|
The interval between major tick marks.
|
|
[XYZ]TICKLAYOUT |
Set to 1 to suppress tick marks; set to 2 to draw a box around the tick labels.
|
|
[XYZ]TICKLEN |
The length of each major tick mark, normalized to the width or height of the graphic. The default value is automatically calculated based upon the aspect ratio of the graphic.
|
|
[XYZ]TICKNAME |
A string array containing the tick labels.
|
|
[XYZ]TICKUNITS |
A string giving the tick units. Valid values are: null (the default, signified by empty quotes), Years, Months, Days, Hours, Minutes, Seconds, Time, exponent for exponential notation, or scientific for scientific notation.
If any of the time units are utilized, then the tick values are interpreted as Julian date/time values. If more than one unit is provided, the axis will be drawn with multiple levels.
|
|
[XYZ]TICKVALUES |
An array of tick mark locations.
|
|
[XYZ]TITLE |
A string giving the axis title.
|
|
[XYZ]TRANSPARENCY
|
An integer from 0-100 giving the percent transparency.
|
For more detailed explanations of these properties, see the AXIS function.
Tip: You can also use the AXIS function to insert additional axes after the graphic has been created.
BUFFER
Set this keyword to 1 to direct the graphics to an off-screen buffer instead of creating a window.
CURRENT
Set this keyword to create the graphic in the current window with a new set of axes. If no window exists, a new window is created. The WINDOW's SetCurrent method may be used to set the current window.
Or, set this keyword to an existing IDL Graphic reference to make that window be the current window and direct the new graphic to that window.
Tip: The CURRENT keyword is usually used with the LAYOUT keyword or POSITION property to produce a window which has multiple graphics in different locations.
Tip: For the graphic share the same axes as an existing graphic, use the OVERPLOT keyword instead.
DEVICE
Set this keyword if values are specified in device coordinates (pixels) for the MARGIN and POSITION keywords. (Normalized coordinates are the default for these keywords.)
DIMENSIONS
Set this keyword to a two-element vector of the form [width, height] to specify the window dimensions in pixels. If you do not specify a value for DIMENSIONS, IDL by default uses the values of the IDL_GR_WIN_HEIGHT and IDL_GR_WIN_WIDTH preferences for Windows platforms or the IDL_GR_X_HEIGHT and IDL_GR_X_WIDTH preferences for X Windows systems on UNIX.
Tip: The minimum width is set by the toolbar in the window, usually around 400 pixels. To create a smaller graphics window, use the NO_TOOLBAR keyword.
DRAG_QUALITY
Set this keyword to 0, 1, or 2 to control the rendering quality and performance during moves, transformations, and rotations initiated with the mouse. The default value is 2, which maintains full rendering quality during mouse interactions. Set to 1 to reduce the drawing quality, or to 0 to further reduce or in some cases disable drawing during dragging or resizing.
LAYOUT
Set this keyword to a three-element vector [ncol, nrow, index] that arranges graphics in a grid. The first dimension ncol is the number of columns in the grid, nrow is the number of rows, and index is the grid position at which to place the graphic (starting at element 1). This keyword is ignored if either OVERPLOT or POSITION is specified.
LOCATION
Set this keyword to a two-element vector [X offset, Y offset] giving the window's screen offset in pixels.
MARGIN
Set this keyword to the current graphic’s margin values in the layout specified by the LAYOUT property. Use a scalar value to set the same margin on all sides, or use a four-element vector [left, bottom, right, top] to specify different margins on each side.
By default, margin values are expressed in normalized units ranging from 0.0 to 0.5. If the DEVICE keyword is set, the values are given in device units (pixels).
This keyword is ignored if either OVERPLOT or POSITION is specified.
NO_TOOLBAR
By default the graphics window will have a toolbar containing some common tools such as Print and Save. Set this keyword to remove the toolbar. This keyword has no effect if the window is already created.
Tip: When the toolbar exists, the minimum window width is set to the toolbar's width, usually around 400 pixels. To create a smaller graphics window, use the NO_TOOLBAR keyword.
NODATA
Set this keyword to 1 to create the graphic, but without any data attached to it. The axes and title (if present) are also created and displayed. If the OVERPLOT keyword is specified, axis ranges will not change.
Note: You must still provide valid input arguments. The data range of the input arguments are used to automatically set the range of the axes. The [XYZ]RANGE properties may be used to override these default ranges.
OVERPLOT
Set this keyword to 1 (one) to place the graphic on top of the currently-selected graphic within the current window. The two graphics items will then share the same set of axes. If no current window exists, then this keyword is ignored and a new window is created.
If you have a graphic in another window that is not currently selected, you can also set this keyword to that graphic's reference to overplot on top of that graphic.
Tip: For the graphic to have a new set of axes, use the CURRENT keyword instead.
WIDGETS
By default, when running from the IDL Workbench, the graphics window will use the native widgets for your platform. Set this keyword to instead use IDL widgets for the graphics window. This keyword is ignored when running from the IDL command line, since IDL widgets are always used in that case.
Properties
ANTIALIAS
By default anti-aliasing is used when drawing lines. Set this property to 0 to disable anti-aliasing.
ASPECT_RATIO
Set this property to a floating point value indicating the ratio of the Y dimension to the X dimension in data units. If this property is set to a nonzero value, the aspect ratio will be preserved as the graphic is stretched or shrunk. The default value is 0 for all graphics except images, meaning that the aspect ratio is not fixed, but is allowed to change as the graphic is stretched or shrunk.
AXES (Get Only)
This property retrieves an array that contains all of the AXIS objects within the visualization. For example, for a plot visualization:
p = PLOT(/TEST)
ax = p.AXES
ax[0].TITLE = 'X axis'
ax[1].TITLE = 'Y axis'
ax[2].HIDE = 1
ax[3].HIDE = 1
See AXIS for a list of the available properties.
BACKGROUND_COLOR
Set this property to a string or RGB vector indicating the graphic's background color. The default value is [255, 255, 255] (white). Set this property to a scalar value to remove the background color.
Tip: To set the background color of the entire window, retrieve the window object using the WINDOW property, and set the BACKGROUND_COLOR on the window object.
BACKGROUND_TRANSPARENCY
Set this property to an integer between 0 and 100 giving the percent transparency of the background color. The default is 100 (completely transparent).
Note: If the BACKGROUND_COLOR property is changed, and the current background transparency is 100, then the BACKGROUND_TRANSPARENCY will be automatically set to 0 (opaque) so that you can see the new color.
BOTTOM_COLOR
Set this property to a string or RGB vector indicating the bottom color of the bars. The bars will be shaded between BOTTOM_COLOR and FILL_COLOR. Set BOTTOM_COLOR to -1 to disable shading.
BOTTOM_VALUES
Set this property to a scalar or vector that defines the lower limit of the bars. If BOTTOM_VALUES is a vector it should have the same number of elements as VALUES. If BOTTOM_VALUES is a scalar then the same value will be used for each bar.
C_RANGE
Set C_RANGE to a two element vector, [low, high], denoting the low and high values between which BOTTOM_COLOR and FILL_COLOR should be shaded. Any portions of a bar that exists above the high value or below the low value will be colored FILL_COLOR or BOTTOM_COLOR, respectively. If set to a scalar, each bar will be shaded from BOTTOM_COLOR to FILL_COLOR regardless of bar length.
CLIP
Set this property to 1 to clip portions of the graphic that lie outside of the dataspace range, or to 0 to disable clipping. The default is 1.
COLOR
Set this property to a string or RGB vector indicating the color of the outline around each bar.
CROSSHAIR (Get Only)
Use this property to retrieve a reference to the Crosshair graphic. All graphics objects within the same set of axes share a single Crosshair graphic. For Plot graphics the default behavior is to display the crosshair when a Mouse_Down event is received. For other graphics the crosshair is disabled. The STYLE property may be used to automatically draw the crosshair, while the LOCATION property may be used to manually draw the crosshair.
You can get and set the following properties on the retrieved crosshair:
|
Property |
Description |
|
ANTIALIAS |
Set to 1 to enable anti-aliasing for the lines.
|
|
COLOR |
A string or RGB vector containing the color.
|
|
HIDE |
Set to 1 to hide the crosshair, 0 to show.
|
|
INTERPOLATE |
Set to 1 to force interpolation between Plot data points when SNAP is active. For other graphics this property is ignored. The default is 0.
|
|
LINESTYLE |
An integer or string giving the line style. The default is 'dot'. See Linestyle Values for additional options.
|
|
LOCATION |
The location at which to draw the crosshair. For Plot graphics, if SNAP is enabled, then only the X coordinate needs to be supplied. Otherwise, LOCATION should be set to a two-element vector [X, Y] for two-dimensional graphics or [X, Y, Z] for three-dimensional graphics. If STYLE is currently "None", then setting the LOCATION will automatically set the STYLE to "Manual".
|
|
NAME |
The name of the graphic.
|
|
SNAP |
Set to 1 to snap the crosshair to the nearest Plot data point. For other graphics this property is ignored. The default is 1.
|
|
STYLE |
An integer or string giving the crosshair style. Possible values are:
0 - "None" - never draw the crosshair. This is the default for all graphics except 2D plots.
1 - "Manual" - draw the crosshair using the LOCATION property.
2 - "Auto" - automatically draw the crosshair. This is the default for 2D plots.
|
|
THICK |
The thickness of the lines. The default is 1.
|
|
TRANSPARENCY |
The percent transparency of the lines. The default is 50.
|
|
UVALUE |
An IDL variable of any data type.
|
For example, use the CROSSHAIR property to draw a crosshair on an image:
im = IMAGE(/TEST, TRANSPARENCY=50, AXIS_STYLE=2)
c = im.CROSSHAIR
c.COLOR = 'red'
c.THICK = 2
c.LOCATION = [300, 200]
See Creating Functions to Control Mouse Events for a more detailed crosshair example.
FILL_COLOR
Set this property to a string or RGB vector indicating the plot bar color.
FONT_COLOR
Set this property equal to the text color for the title and axes (if present). The default value is "black".
FONT_NAME
Set this property equal to a string specifying the IDL or system font for the title and axes (if present). The default value is "DejaVuSans".
FONT_SIZE
Set this property equal to an integer specifying the font size for the title and axes (if present). The default value is 9 points for the axis text and 11 points for the title.
FONT_STYLE
Set this property equal to an integer or a string specifying the font style for the title and axes (if present). Allowed values are:
|
Integer |
String |
Resulting Style |
|
0 |
"Normal" or "rm"
|
Default (roman) |
|
1 |
"Bold" or "bf" |
Bold |
|
2 |
"Italic" or "it"
|
Italic |
|
3 |
"Bold italic" or "bi"
|
Bold italic |
HIDE
Set this property to 1 to hide the graphic. Set HIDE to 0 to show the graphic.
HISTOGRAM
By default the bars in the bar plot are centered at each X location. Set this property to 1 to make the bars start at the X location of each point and extend to the next X location.
Tip: Use the default (HISTOGRAM=0) for bar plots of "discrete" data where each bin represents the number of items that have a certain integer value. Use HISTOGRAM=1 for bar plots of "continuous" data where each bin represents the number of items that fall within a certain range of X values.
HORIZONTAL
If set to 1 or preceded with a "/", the bars will be drawn horizontally (parallel to the X axis). The default behavior is to draw vertical bars (parallel to the Y axis). This is on a per bar plot basis; setting this property on a given bar plot will not affect any currently existing bar plots.
INDEX
If side-by-side bars are being created, INDEX specifies which bar, out of NBARS, that the current bar plot occupies. This value is zero-based and begins on the left. This value is used on a per bar plot basis and should be used in conjunction with NBARS. The default value is 0.
LINESTYLE
Set this property to the line style used to draw the outline around each bar. The default value is a solid line.
NAME
Set this property to a string that specifies the name of the graphic. The name can be used to retrieve the graphic using the brackets array notation. If NAME is not set then a default name is chosen based on the graphic type.
NBARS
If side-by-side bars are being created, NBARS specifies the number of bars that exists per LOCATION. This value is used on a per bar plot basis and should be used in conjunction with INDEX. The default behavior is one bar per LOCATION.
OUTLINE
If set to 1 (the default behavior), an outline will be displayed around each bar. If set to zero, no outline will be displayed around each bar.
PATTERN_BITMAP
By default the barplot is filled with a solid color given by FILL_COLOR. Instead, you can specify a fill pattern as a 32x32 bit array (bitmap). The bitmap must be constructed as a 4x32 "bitmap byte array" as created by the CVTTOBM function. Each bit that is a 1 is drawn, each bit that is 0 is not drawn. Each bit in this array represents a 1 point by 1 point square area of pixels on the destination device.
Note: To turn off pattern fill set PATTERN_BITMAP to a scalar 0.
PATTERN_ORIENTATION
By default the barplot is filled with a solid color given by FILL_COLOR. By setting any of the PATTERN_ORIENTATION, PATTERN_SPACING, or PATTERN_THICK properties, your barplot will be filled with a line pattern. Set PATTERN_ORIENTATION to the angle (in degrees counterclockwise from horizontal) of the lines. The default is 0 degrees.
Note: To turn off line fill set PATTERN_SPACING to 0.
PATTERN_SPACING
By default the barplot is filled with a solid color given by FILL_COLOR. By setting any of the PATTERN_ORIENTATION, PATTERN_SPACING, or PATTERN_THICK properties, your barplot will be filled with a line pattern. Set PATTERN_SPACING to the distance (in points) between the lines in the line fill. The default is 0.0 points.
Note: To turn off line fill set PATTERN_SPACING to 0.
PATTERN_THICK
By default the barplot is filled with a solid color given by FILL_COLOR. By setting any of the PATTERN_ORIENTATION, PATTERN_SPACING, or PATTERN_THICK properties, your barplot will be filled with a line pattern. Set PATTERN_THICK to a value between 0.0 and 10.0 that specifies the line thickness (in points) for the line fill. A thickness of 0 displays a thin hairline. The default is 1.0 points.
Note: To turn off line fill set PATTERN_SPACING to 0.
POSITION
Set this property to a four-element vector that determines the position of the graphic within the window. The coordinates [X1, Y1, X2, Y2] define the lower left and upper right corners of the graphic. Coordinates are expressed in normalized units ranging from 0.0 to 1.0. On creation, if the DEVICE keyword is set, the units are given in device units (pixels).
Note: After creation, you can set the POSITION to either a two or four-element vector. If two elements are provided, the center of the graphic will be translated to that position. If four elements are provided, the graphics will be translated and scaled to fit the position.
THICK
The thickness of the outline around each bar. A value between 0 and 10 that specifies the line thickness. A thickness of 0 displays a thin hairline on the chosen device. The default value is 1.
TITLE
Set this property to a string specifying a title. The title properties may be modified using FONT_COLOR, FONT_NAME, FONT_SIZE, and FONT_STYLE. After creation the TITLE property may be used to retrieve a reference to the title text object, and the TEXT properties may be used to modify the title object.
You can add Greek letters and mathematical symbols using a TeX-like syntax, enclosed within a pair of "$" characters. See Adding Mathematical Symbols and Greek Letters to the Text String for details.
TRANSPARENCY
Set this property to the percent transparency of the bars, which can be an integer between 0 and 100. The default value is 0.
UVALUE
Set this property to an IDL variable of any data type.
WIDTH
Set this property to the width of every bar, represented as a scalar value. This value ranges from 0 to 1. The default value is 0.8.
WINDOW (Get Only)
This property retrieves a reference to the WINDOW object which contains the graphic.
WINDOW_TITLE
Set this property to the title of the IDL Graphic window. The title is displayed in the window's title bar.
XRANGE
Set this property to a two-element vector giving the X data range to plot. The default behavior is to plot the entire data range.
YRANGE
Set this property to a two-element vector giving the Y data range to plot. The default behavior is to plot the entire data range.
Additional Examples
The following lines create the plot shown.
nBars = 3
index = 0
colors = ['red', 'yellow', 'blue']
data = RANDOMU(s, 10, nBars)
FOR i=0, nBars-1 DO $
b = BARPLOT(data[*,i], NBARS=nBars, INDEX=index++, $
FILL_COLOR=colors[i], /OVERPLOT)
Stacked Bar Plot
data1 = SIN((FINDGEN(15)+1)/15*!PI/2)
data2 = data1+COS((FINDGEN(15)+0)/15*!PI/2)
data3 = data2+0.25+RANDOMU(s,15)
b1 = BARPLOT(data1, PATTERN_ORIENTATION=45, $
PATTERN_SPACING=6, PATTERN_THICK=2)
b2 = BARPLOT(data2, BOTTOM_VALUES=data1, $
FILL_COLOR='yellow', /OVERPLOT, PATTERN_ORIENTATION=45, $
PATTERN_SPACING=6, PATTERN_THICK=2)
b3 = BARPLOT(data3, BOTTOM_VALUES=data2, $
FILL_COLOR='red', /OVERPLOT, PATTERN_ORIENTATION=45, $
PATTERN_SPACING=6, PATTERN_THICK=2)
Horizontal Floating Shaded Bar Plot
data = (RANDOMU(s,10)+0.1) < 1
bottom = (data/4-0.1) > 0
b = BARPLOT(data, $
BOTTOM_VALUES=bottom, $
FILL_COLOR='red', $
BOTTOM_COLOR='yellow', $
C_RANGE=[0,1], $
/HORIZONTAL, PATTERN_ORIENTATION=45, $
PATTERN_SPACING=6, PATTERN_THICK=3)
Version History
| 8.0 |
Introduced |
| 8.1 |
Added the following properties: CROSSHAIR, UVALUE, WINDOW, [XYZ]SHOWTEXT, [XYZ]STYLE
The THICK property was changed to accept a value between 0 and 10.
Added the following methods: Delete, GetData, GetValueAtLocation, SetData.
|
| 8.2 |
Added AXES, BACKGROUND_COLOR, BACKGROUND_TRANSPARENCY properties. |
| 8.2.1 |
Added ANTIALIAS property.
[XYZ]TICKUNITS accepts exponent as a value.
|
| 8.2.2 |
Change POSITION from a keyword to a property.
Added HISTOGRAM property.
|
| 8.5 |
Added PATTERN_BITMAP, PATTERN_ORIENTATION, PATTERN_SPACING, and PATTERN_THICK properties. |
| 8.6 |
Changed default font name and font size. |
See Also
!COLOR, PLOT, ERRORPLOT, Formatting IDL Graphics Symbols and Lines , Using IDL graphics
Resources and References
Data for the first example is from:
USGS Patuxent Wildlife Research Center, Maryland: North American Breeding Bird Survey, 2012.