The AXIS function adds an axis to an existing IDL Graphic.
Example
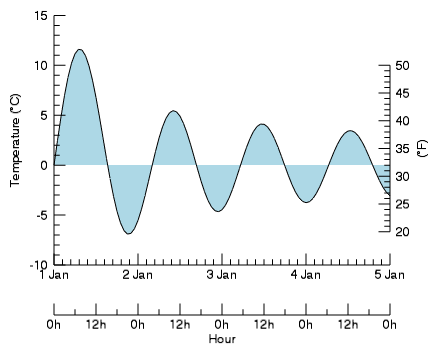
The following lines create the graphic shown on the right.
tstart = JULDAY(1,1,2000,0,0,0)
tend = JULDAY(1,5,2000,0,0,0)
time = TIMEGEN(START=tstart, FINAL=tend, UNITS='Hours')
data = 20*BESELJ(FINDGEN(97)/4, 1)
p = PLOT(time, data, MARGIN=[0.15,0.25,0.15,0.1], $
AXIS_STYLE=1, FILL_COLOR="light blue", $
FILL_BACKGROUND=1, FILL_LEVEL=0, $
YTITLE='$Temperature (\deg C)$', $
XSTYLE=1, XTICKFORMAT='(C(CDI,1x,CMoA))')
xaxis = AXIS('X', LOCATION=-15, $
TITLE='Hour', TICKINTERVAL=0.5, $
MINOR=1, TICKFORMAT='(C(CHI),"h")')
yaxis = AXIS('Y', LOCATION='right', $
TITLE='$(\deg F)$', $
COORD_TRANSFORM=[32, 9.0/5.0], $
AXIS_RANGE=[20,50])
Syntax
graphic = AXIS(Direction, ] [, Keywords=value] [, Properties=variable])
Keywords
Keywords are applied only during the initial creation of the graphic.
[, LOCATION=value] [, TARGET=variable]
Properties
Properties can be set as keywords to the function during creation, or retrieved or changed using the "." notation after creation.
Methods
Close
ConvertCoord
CopyWindow
Delete
Erase
Order
Print
Refresh
Rotate
Save
Scale
Select
Translate
Return Value
The AXIS function returns a reference to the created graphic. Use the returned reference to manipulate the graphic after creation by changing properties or calling methods.
Arguments
Direction
Set this argument to a string or an integer giving the axis direction. Possible values are:
- 0 or 'X' - Create an x-axis.
- 1 or 'Y' - Create a y-axis.
- 2 or 'Z' - Create a z-axis.
The LOCATION property may be used to set the axis location.
Keywords
Keywords are applied only during the initial creation of the graphic.
LOCATION
Set this keyword to a scalar number, a string, or a vector giving the location of the new axis in data coordinates.
For a two-dimensional graphic, the LOCATION should be set to one of the following:
- A scalar number giving the location along the direction perpendicular to the axis. For example, for an x-axis, specify the y location. For a y-axis, specify the x location.
- A scalar string giving the location. For an x-axis, the possible location strings are "bottom," "center," or "top." For a y-axis, the possible location strings are "left," "center," or "right."
For a three-dimensional graphic, the LOCATION should be set to one of the following:
- A two-element vector giving the location along the two directions that are orthogonal to the axis. For example, for an x-axis, you would specify [y, z]. For a y-axis, you would specify [x, z]. For a z-axis, you would specify [x, y].
- A two-element string array giving the location along the two orthogonal directions. Valid strings are "left," "right," "bottom," "top," and "center." For example, assume your 3D plot has axis ranges given by xrange, yrange, and zrange. The values "left" and "bottom" are interchangeable and correspond to xrange[0], yrange[0], and zrange[0]. The values "right" and "top" are interchangeable and correspond to xrange[1], yrange[1], and zrange[1]. For example, to add a new Z axis to a 3D plot, you could specify LOCATION=["right", "bottom"] to position the axis at location (xrange[1], yrange[0]).
If you specify LOCATION as a string, then AXIS will automatically choose the tick direction and text position that best fits that axis. For example, for an x-axis on a plot, if you set LOCATION='top', then your axis will have ticks that point downward (TICKDIR=1) and text above the axis (TEXTPOS=1).
TARGET
Set this keyword to the graphic to which the axis should be associated. If TARGET is not specified then the current graphic will be used.
Properties
ANTIALIAS
By default, anti-aliasing is used when drawing lines. Set this property to 0 to disable anti-aliasing.
AXIS_RANGE
A two-element vector giving the visible range of the axis. By default the axis covers the entire dataspace range. Set this property to [0, 0] to revert back to the default behavior. See Axes for an example.
- If COORD_TRANSFORM is also set, then this property should be set in the "transformed" axis units, not the dataspace units.
- Setting this property has no effect on the dataspace range of the graphic. The [XYZ]RANGE properties may be used to control the dataspace range.
- If the AXIS_RANGE lies partially outside of the dataspace range, then the axis range will be clamped to the dataspace range. If the AXIS_RANGE lies completely outside of the dataspace range, then the property will be ignored and the axis will cover the entire dataspace range.
CLIP
Set to 0 to disable clipping, or to 1 to enable it. This property is ignored unless the DATA property is set.
COLOR
A string or RGB vector giving the axis color. If the COLOR and the TEXT_COLOR were previously the same, then setting COLOR will also set TEXT_COLOR to the same value.
COORD_TRANSFORM
Set this property to a two-element vector, [a, b], giving the coordinate transform between the dataspace coordinates (in the direction of this axis) and the axis coordinates. The a and b describe a simple linear transform:
AxisCoord = a + b * DataCoord
The default value indicates that no transform will take place. The COORD_TRANSFORM is useful for creating an axis where the axis tick units are different than the original graphic units. For example, if your data is in degrees Celsius, you could add a new Y axis with units in degrees Fahrenheit by specifying COORD_TRANSFORM = [32, 9.0/5]. See Axes for an example.
DATA
If set to 1, locks the axis location to the dataspace position. In this case, if the dataspace range changes, the axis will move along with the data. The default is 0, which locks the axis location to the position within the window. See Axes for an example.
If DATA is set, then the axis and tick labels will be automatically clipped when they extend past the edge of the graphic's data range. You can set CLIP=0 to disable this behavior.
GRIDSTYLE
Gives the linestyle to be used for the major tickmarks.
The following table lists the index values and strings you can use with this property.
|
Index |
Property |
Description |
|
0 |
'solid_line', '-'(dash)
|
solid line |
|
1 |
'dot', ':'(colon)
|
dotted |
|
2 |
'dash', '--' (double dashes)
|
dashed |
|
3 |
'dash_dot', '-.'
|
dash dot |
|
4 |
'dash_dot_dot_dot', '-:'
|
dash dot dot dot
|
|
5 |
'long_dash', '__' (two underscores)
|
long dash |
|
6 |
'none', ' ' (space)
|
no line |
You can also set the line style to a two-element vector, [repeat, bitmask], specifying a stippling pattern. The repeat indicates the number of times that individual bits in the bitmask should be repeated. (That is, if three consecutive 0’s appear in the bitmask and the value of repeat is 2, then the line that is drawn will have six consecutive bits turned off.) The value of repeat must be an integer between 1 and 255. The bitmask indicates which pixels are drawn and which are not along the length of the line. The bitmask should be specified as a 16-bit hexadecimal value. For example, [2, 'AAAA'X] describes a dashed line with very short dashes of length 2 bits each.
HIDE
When set to 1, this property hides the graphic. Set to 0 to show the graphic.
LOG
Set this property to 1 to specify a logarithmic axis. The minimum value of the axis range must be greater than zero.
MAJOR
Represents the number of major tick marks on the axis. The default value of -1 specifies that IDL will compute the number of tickmarks. Setting MAJOR to 0 suppresses major tickmarks entirely.
MINOR
Represents the number of minor tick marks. The default value of -1 indicates that IDL will compute the number of tickmarks. Setting this property equal to 0 suppresses minor tickmarks entirely.
NAME
Specifies the name of the graphic. The name can be used to retrieve the graphic using the brackets array notation. If NAME is not set then a default name is chosen based on the graphic type.
SHOWTEXT
Set this property to 1 to show text labels or to 0 to hide text labels.
SUBGRIDSTYLE
Indicates the linestyle to be used for the minor tick marks. Set this property to -1 to force the minor ticks to have the same linestyle as the major ticks.
The following table lists the index values and strings you can use with this property.
|
Index |
Property |
Description |
|
0 |
'solid_line', '-'(dash)
|
solid line |
|
1 |
'dot', ':'(colon)
|
dotted |
|
2 |
'dash', '--' (double dashes)
|
dashed |
|
3 |
'dash_dot', '-.'
|
dash dot |
|
4 |
'dash_dot_dot_dot', '-:'
|
dash dot dot dot
|
|
5 |
'long_dash', '__' (two underscores)
|
long dash |
|
6 |
'none', ' ' (space)
|
no line |
You can also set the line style to a two-element vector, [repeat, bitmask], specifying a stippling pattern. The repeat indicates the number of times that individual bits in the bitmask should be repeated. (That is, if three consecutive 0’s appear in the bitmask and the value of repeat is 2, then the line that is drawn will have six consecutive bits turned off.) The value of repeat must be an integer between 1 and 255. The bitmask indicates which pixels are drawn and which are not along the length of the line. The bitmask should be specified as a 16-bit hexadecimal value. For example, [2, 'AAAA'X] describes a dashed line with very short dashes of length 2 bits each.
SUBTICKLEN
A floating point scale ratio specifying the length of minor tick marks relative to the length of major tick marks. The default value of 0.5 indicates that the minor tick mark is one-half the length of the major tick mark. The length of the major tick marks can be changed with the TICKLEN property.
TEXT_COLOR
A string or RGB vector containing the axis text color. The default value is the same color as the COLOR property.
TEXT_ORIENTATION
The angle (in degrees) of the tick mark labels. The default is 0.
TEXTPOS
When set to 1, positions the tick labels and axis title above the axis. The default is 0, below the axis.
Tip: The TICKDIR property may be used to control the direction of axis tick marks.
THICK
A value between 0 and 10 that specifies the line thickness of the plotted lines.
TICKDIR
When set to 1, IDL draws the tickmarks facing outwards. The default of 0 indicates that tickmarks should face inwards.
Tip: The TEXTPOS property may be used to control the position of tick mark data values and axis titles.
TICKFONT_NAME
Set this property to a string specifying the IDL or system font for the tick labels and axis title. The default value is "DejaVuSans".
TICKFONT_SIZE
A number representing the point size of the axis text. The default value is 9 points.
TICKFONT_STYLE
Specifies the font style for the axis labels and title. Allowed values are: "normal" or "rm" (0), "bold" or "bf" (1), "italic" or "it" (2), and "bold italic" or "bi" (3).
TICKFORMAT
Represents a format string or the name of a function to be used to format the tick mark labels. TICKFORMAT can also be set to an array of format strings for each tick mark. If an array is provided, each string corresponds to a level of the axis. The TICKUNITS property determines the number of levels for an axis.
If the string begins with an open parenthesis, it is treated as a standard format string.
If the string does not begin with an open parenthesis, it is interpreted as the name of a callback function to be used to generate tick mark labels. This function is defined with either three or four parameters, depending on whether TICKUNITS is specified.
If TICKUNITS is not specified:
- The callback function is called with three parameters: Axis, Index, and Value, where:
- Axis is the axis number (0 for X axis, 1 for Y axis, 2 for Z axis)
- Index is the tick mark index (indices start at 0)
- Value is the data value at the tick mark (a double-precision floating point value)
If TICKUNITS is specified:
The callback function is called with four parameters: Axis, Index, Value, and Level, where:
- Axis, Index, and Value are the same as described previously.
- Level is the index of the axis level for the current tick value to be labeled. (Level indices start at 0.)
TICKINTERVAL
Indicates the interval between major tick marks for the first axis level. The default value is computed according to the axis range and the number of major tick marks (MAJOR). If this property is set then the MAJOR property is ignored.
For example, if TICKUNITS = ['S', 'H', 'D'], and TICKINTERVAL = 30, then the interval between major ticks for the first axis level will be 30 seconds.
TICKLAYOUT
Indicates the tick layout style to be used to draw each level of the axis. When set to 0 (the default), IDL draws the axis line, tick marks, and tick labels. Set to 1 to only draw the labels. Set to 2 to draw a box around the tick labels.
If no tick labels are being displayed (SHOWTEXT=0), then you can only set TICKLAYOUT to 0. Other values will be ignored.
For all tick layout styles, at least one tick label will appear on each level of the axis (even if no major tick marks fall along the axis line). If there are no major tick marks, the single tick label will be centered along the axis.
TICKLEN
Set this property to a floating point value between 0.0 and 1.0 that specifies the length of each major tick mark, relative to the width or height of the graphic. For example, when creating a Y axis, setting TICKLEN=0.1 will create tick marks that are 10% of the width of the plot.
If you do not specify TICKLEN, then IDL will use the current tick mark length for the given axis direction.
Tip: If you have axes on both the left and right sides (or the top and bottom) of your graphic, set the tick length to 0.5 on both axes to create tick marks that stretch across the entire graphic. If you only have a single axis, then set the tick length to 1 to produce tick marks that stretch across the entire graphic. In either case, you may want to set SUBTICKLEN to a smaller value than the default of 0.5.
TICKNAME
Set this property to a string array containing the tick mark labels. Set this property to an empty string to set the tick labels back to their default values.
TICKUNITS
Indicates the units to be used for axis tick labeling. If more than one unit is provided, the axis will be drawn in multiple levels, one level per unit. The order in which the strings appear in the vector determines the order in which the corresponding unit levels will be drawn. The first string corresponds to the first level (the level nearest to the primary axis line).
Valid unit strings include:
- "" - The default, indicating that no tick units are being set. IDLgrAxis will use regular numbers (non-scientific notation) for tick labels in the range to 10-4 to 104, and scientific notation for tick labels smaller than 10-4 or larger than 104.
- "Numeric" - IDLgrAxis will use regular numbers (non-scientific notation) for tick labels in the range to 10-10 to 1010, and scientific notation for tick labels smaller than 10-10 or larger than 1010.
- "Scientific" - IDLgrAxis will use scientific (exponential) notation for all tick labels (except 0.0).
- "Years" - The tick values are in years. IDL will assume that the tick values are in Julian date/times and will only label the "year" portion.
- "Months" - The tick values are in months. IDL will assume that the tick values are in Julian date/times and will only label the "month" portion.
- "Days" - The tick values are in days. IDL will assume that the tick values are in Julian date/times and will only label the "day" portion.
- "Hours" - The tick values are in hours. IDL will assume that the tick values are in Julian date/times and will only label the "hour" portion.
- "Minutes" - The tick values are in minutes. IDL will assume that the tick values are in Julian date/times and will only label the "minute" portion.
- "Seconds" - The tick values are in seconds. IDL will assume that the tick values are in Julian date/times and will only label the "second" portion.
- "Time" - Use this value to indicate that the tick values are time values; IDL will determine the appropriate time intervals and tick label formats based upon the range of values covered by the axis.
The singular form of each of the time value strings is also acceptable (e.g, TICKUNITS='Day' is equivalent to TICKUNITS='Days').
Julian values must be in the range -1095 to 1827933925, which corresponds to calendar dates 1 Jan 4716 B.C.E. and 31 Dec 5000000 A.D., respectively.
TICKVALUES
An array indicating tick mark locations. If TICKVALUES is set to 0 (the default value), IDL computes the tick values based on the axis range and the number of major ticks.
TITLE
Represents the title of the specified axis.
You can add Greek letters and mathematical symbols using a TeX-like syntax, enclosed within a pair of "$" characters. See Adding Mathematical Symbols and Greek Letters to the Text String for details.
TRANSPARENCY
Set this property to an integer between 0 and 100 that specifies the percent transparency of the axis.
UVALUE
Set this property to an IDL variable of any data type.
WINDOW (Get Only)
This property retrieves a reference to the WINDOW object which contains the graphic.
Version History
|
8.0 |
Introduced |
|
8.1 |
Added the following properties: UVALUE, SHOWTEXT, TICKNAME
The THICK property was changed to accept a value between 0 and 10
Added the Delete method
|
|
8.2 |
Added the COORD_TRANSFORM and TEXT_ORIENTATION properties
|
|
8.2.1 |
[XYZ]TICKUNITS accepts exponent as a value
|
|
8.2.2 |
Improve LOCATION keyword to accept scalar values and strings. The old LOCATION behavior (with a 3-element vector) is no longer documented, but will continue to work.
|
|
8.2.3 |
Added SUBGRIDSTYLE property. By default minor ticks now have a solid linestyle, regardless of the linestyle of the major ticks.
Added the ability to use a stippling pattern for GRIDSTYLE.
|
|
8.4 |
Added TICKUNITS="numeric" and TICKUNITS="scientific"
|
| 8.6 |
Changed default font name and font size. |
See Also
!COLOR, Axes, Axis References in IDL Graphics, IMAGE,
SURFACE, Using IDL graphics