The BUBBLEPLOT function creates a bubble chart that displays three dimensions of data in a two-dimensional Cartesian coordinate system. A bubble chart is similar to a scatter plot except that it additionally displays the magnitude of the data at a given (x, y) position.
BUBBLEPLOT() accepts data as a series of X and Y coordinates, with MAGNITUDE at a given point reflected in the relative diameter of the bubble.
Examples
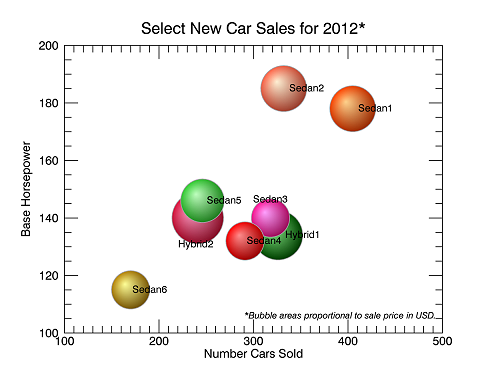
The following code creates the graphic shown above. Copy and paste it to the IDL command line to run it.
sales = [405,332,326,318,291,246,241,170]
HP = [178,185,134,140,132,146,140,115]
price = [22,22,25,16,16,20,27,16]
cars = ['Sedan1','Sedan2','Hybrid1','Sedan3','Sedan4','Sedan5', $
'Hybrid2','Sedan6']
colors = ['dark green','deep pink','tomato','lime green', $
'dark goldenrod','red','orange red','crimson']
locations = ['right','right','right','top','right','right', $
'bottom','right']
BP4 = BUBBLEPLOT(sales, HP, MAGNITUDE=Price, $
YTITLE='Base Horsepower', $
XTITLE='Number Cars Sold', $
LABELS=cars, LABEL_FONT_SIZE=10, $
COLOR=colors, /SHADED, EXPONENT=.5, $
LABEL_POSITION=locations,$
TITLE='Select New Car Sales for 2012*')
carText = TEXT(290, 105, TARGET=BP4, $
'*Bubble areas proportional to sale price in USD.', $
/DATA, COLOR='black', FONT_SIZE=9, FONT_STYLE='italic')
BP4.TITLE.FONT_SIZE = 16
See Additional Examples at the bottom of this topic, as well as the Bubbleplot "Guide Me" example, for more information on using the BUBBLEPLOT function.
Syntax
graphic = BUBBLEPLOT(X, Y [, Keywords=value] [, Properties=value])
Keywords
Keywords are applied only during the initial creation of the graphic.
AXIS_STYLE=value /BUFFER, /CURRENT, /DEVICE, DIMENSIONS=[width, height], DRAG_QUALITY=quality, LAYOUT=array, LOCATION=[x, y], MARGIN=scalar or [left, bottom, right, top], /NO_TOOLBAR, /NODATA, /OVERPLOT, /WIDGETS
Properties
Properties can be set as keywords to the function during creation, or retrieved or changed using the "." notation after creation.
ANTIALIAS, ASPECT_RATIO, AXES, BACKGROUND_COLOR, BACKGROUND_TRANSPARENCY, BORDER, CLIP, COLOR, CROSSHAIR, EXPONENT, FILLED, FONT_COLOR, FONT_NAME, FONT_SIZE, FONT_STYLE, HIDE, LABEL_ALIGNMENT, LABEL_BASELINE, LABEL_FONT_COLOR, LABEL_FONT_NAME, LABEL_FONT_SIZE, LABEL_FONT_STYLE, LABEL_POSITION, LABEL_UPDIR, LABEL_VERTICAL_ALIGNMENT, LABELS, LINECOLOR, LINETHICK, LINESTYLE, MAGNITUDE, MAX_VALUE, NAME, POSITION, RGB_TABLE, SHADED, SIZING, TITLE, UVALUE, WINDOW, WINDOW_TITLE, XRANGE, YRANGE
Methods
Close
ConvertCoord
CopyWindow
Delete
Erase
GenerateCode
GetData
GetValueAtLocation
MapForward
MapInverse
Order
Print
Refresh
Rotate
Save
Scale
Select
SetData
Translate
Return Value
The BUBBLEPLOT function returns a reference to the created graphic. Use the returned reference to manipulate the graphic after creation by changing properties or calling methods.
Arguments
X , Y
Vectors of equal length representing the abscissa (X) and ordinate (Y) values of the centers of the bubbles to plot.
Keywords
AXIS_STYLE
Set this keyword to one of the following values:
- 0 - No axes. Decrease the margins so the graphic almost fills the window. This is the default for images.
- 1 - Single X, Y (and Z if 3D) axes located at the minimum data value. The margins will be adjusted to leave space for the axes. This is the default for 3D graphics.
- 2 - Box axes - multiple axes located at both the minimum and maximum data values. The margins will be adjusted to leave space for the axes. This is the default for 2D graphics.
- 3 - Crosshair-style axes - located at the midpoint of each data dimension. Since the axes are in the middle, decrease the margins so the graphic almost fills the window. This is the default for polar plots.
- 4 - No axes, but use the same margins as if axes were there. This is useful if you want to later add another graphic that does have axes, and you want the two visualizations to be aligned properly.
You can set the following properties on the axes:
|
Property |
Description |
|
[XYZ]COLOR |
A string or RGB vector containing the axis color.
|
|
[XYZ]GRIDSTYLE |
A string, integer, or 2-element vector giving the linestyle for tickmarks.
|
|
[XYZ]LOG |
Set to 1 if the axis is logarithmic. The minimum value of the axis range must be greater than zero.
|
|
[XYZ]MAJOR |
The number of major tick marks. Set to -1 to auto-compute, set to 0 to suppress.
|
|
[XYZ]MINOR |
The number of minor tick marks. Set to -1 to auto-compute, set to 0 to suppress.
|
|
[XYZ]SUBGRIDSTYLE
|
A string, integer, or 2-element vector giving the linestyle for the minor tickmarks. The default is 0, for solid lines. Set to -1 to force minor ticks to have the same linestyle as major ticks.
|
|
[XYZ]SHOWTEXT |
Set to 1 to show text labels or 0 to hide the text labels.
|
|
[XYZ]STYLE |
The axis range style. The valid values are:
(0) Nice range. Default for all graphics except Image, Barplot, and Map.
(1) Force the exact data range. Default for Image, Barplot, and Map.
(2) Pad the axes slightly beyond the nice range.
(3) Pad the axes slightly beyond the exact data range.
The [XYZ]RANGE takes precedence over this property.
|
|
[XYZ]SUBTICKLEN |
The ratio of the minor tick length to the major tick length. The default is 0.5.
|
|
[XYZ]TEXT_COLOR |
A string or RGB vector containing the axis text color.
|
|
[XYZ]TEXT_ORIENTATION
|
The angle (in degrees) of the tick mark labels.
|
|
[XYZ]TEXTPOS |
Set to 1 to position text above the axis. The default is 0, below the axis.
|
|
[XYZ]THICK |
Set to a floating-point value between 0 and 10 to specify the line thickness for tickmarks. A thickness of 0 gives a thin hairline. The default is 1.
|
|
[XYZ]TICKDIR |
Set to 1 to draw the tickmarks facing outwards. The default is 0, facing inwards.
|
|
[XYZ]TICKFONT_NAME
|
A string containing the font name for the axis text.
|
|
[XYZ]TICKFONT_SIZE
|
The axis text size in points.
|
|
[XYZ]TICKFONT_STYLE
|
A string or integer containing the font style: normal (0), bold (1), italic (2), or bold italic (3).
|
|
[XYZ]TICKFORMAT |
A string or string array of tick label formats. See Format Codes for more information.
|
|
[XYZ]TICKINTERVAL
|
The interval between major tick marks.
|
|
[XYZ]TICKLAYOUT |
Set to 1 to suppress tick marks; set to 2 to draw a box around the tick labels.
|
|
[XYZ]TICKLEN |
The length of each major tick mark, normalized to the width or height of the graphic. The default value is automatically calculated based upon the aspect ratio of the graphic.
|
|
[XYZ]TICKNAME |
A string array containing the tick labels.
|
|
[XYZ]TICKUNITS |
A string giving the tick units. Valid values are: null (the default, signified by empty quotes), Years, Months, Days, Hours, Minutes, Seconds, Time, exponent for exponential notation, or scientific for scientific notation.
If any of the time units are utilized, then the tick values are interpreted as Julian date/time values. If more than one unit is provided, the axis will be drawn with multiple levels.
|
|
[XYZ]TICKVALUES |
An array of tick mark locations.
|
|
[XYZ]TITLE |
A string giving the axis title.
|
|
[XYZ]TRANSPARENCY
|
An integer from 0-100 giving the percent transparency.
|
For more detailed explanations of these properties, see the AXIS function.
Tip: You can also use the AXIS function to insert additional axes after the graphic has been created.
BUFFER
Set this keyword to 1 to direct the graphics to an off-screen buffer instead of creating a window.
CURRENT
Set this keyword to create the graphic in the current window with a new set of axes. If no window exists, a new window is created. The WINDOW's SetCurrent method may be used to set the current window.
Or, set this keyword to an existing IDL Graphic reference to make that window be the current window and direct the new graphic to that window.
Tip: The CURRENT keyword is usually used with the LAYOUT keyword or POSITION property to produce a window which has multiple graphics in different locations.
Tip: For the graphic share the same axes as an existing graphic, use the OVERPLOT keyword instead.
DEVICE
Set this keyword if values are specified in device coordinates (pixels) for the MARGIN and POSITION keywords. (Normalized coordinates are the default for these keywords.)
DIMENSIONS
Set this keyword to a two-element vector of the form [width, height] to specify the window dimensions in pixels. If you do not specify a value for DIMENSIONS, IDL by default uses the values of the IDL_GR_WIN_HEIGHT and IDL_GR_WIN_WIDTH preferences for Windows platforms or the IDL_GR_X_HEIGHT and IDL_GR_X_WIDTH preferences for X Windows systems on UNIX.
Tip: The minimum width is set by the toolbar in the window, usually around 400 pixels. To create a smaller graphics window, use the NO_TOOLBAR keyword.
DRAG_QUALITY
Set this keyword to 0, 1, or 2 to control the rendering quality and performance during moves, transformations, and rotations initiated with the mouse. The default value is 2, which maintains full rendering quality during mouse interactions. Set to 1 to reduce the drawing quality, or to 0 to further reduce or in some cases disable drawing during dragging or resizing.
LAYOUT
Set this keyword to a three-element vector [ncol, nrow, index] that arranges graphics in a grid. The first dimension ncol is the number of columns in the grid, nrow is the number of rows, and index is the grid position at which to place the graphic (starting at element 1). This keyword is ignored if either OVERPLOT or POSITION is specified.
LOCATION
Set this keyword to a two-element vector [X offset, Y offset] giving the window's screen offset in pixels.
MARGIN
Set this keyword to the current graphic’s margin values in the layout specified by the LAYOUT property. Use a scalar value to set the same margin on all sides, or use a four-element vector [left, bottom, right, top] to specify different margins on each side.
By default, margin values are expressed in normalized units ranging from 0.0 to 0.5. If the DEVICE keyword is set, the values are given in device units (pixels).
This keyword is ignored if either OVERPLOT or POSITION is specified.
NO_TOOLBAR
By default the graphics window will have a toolbar containing some common tools such as Print and Save. Set this keyword to remove the toolbar. This keyword has no effect if the window is already created.
Tip: When the toolbar exists, the minimum window width is set to the toolbar's width, usually around 400 pixels. To create a smaller graphics window, use the NO_TOOLBAR keyword.
NODATA
Set this keyword to 1 to create the graphic, but without any data attached to it. The axes and title (if present) are also created and displayed. If the OVERPLOT keyword is specified, axis ranges will not change.
Note: You must still provide valid input arguments. The data range of the input arguments are used to automatically set the range of the axes. The [XYZ]RANGE properties may be used to override these default ranges.
OVERPLOT
Set this keyword to 1 (one) to place the graphic on top of the currently-selected graphic within the current window. The two graphics items will then share the same set of axes. If no current window exists, then this keyword is ignored and a new window is created.
If you have a graphic in another window that is not currently selected, you can also set this keyword to that graphic's reference to overplot on top of that graphic.
Tip: For the graphic to have a new set of axes, use the CURRENT keyword instead.
WIDGETS
By default, when running from the IDL Workbench, the graphics window will use the native widgets for your platform. Set this keyword to instead use IDL widgets for the graphics window. This keyword is ignored when running from the IDL command line, since IDL widgets are always used in that case.
Properties
ANTIALIAS
By default, anti-aliasing is used when drawing symbols. Set this property to 0 to disable anti-aliasing.
ASPECT_RATIO
A floating point value indicating the ratio of the Y dimension to the X dimension in data units. If this property is set to a nonzero value, the aspect ratio will be preserved as the graphic is stretched or shrunk. The default value is 0 for all graphics except images, meaning that the aspect ratio is not fixed, but is allowed to change as the graphic is stretched or shrunk.
AXES (Get Only)
This property retrieves an array that contains all of the AXIS objects within the visualization. For example, for a plot visualization:
p = PLOT(/TEST)
ax = p.AXES
ax[0].TITLE = 'X axis'
ax[1].TITLE = 'Y axis'
ax[2].HIDE = 1
ax[3].HIDE = 1
See AXIS for a list of the available properties.
BACKGROUND_COLOR
Set this property to a string or RGB vector indicating the graphic's background color. The default value is [255, 255, 255] (white). Set this property to a scalar value to remove the background color.
Tip: To set the background color of the entire window, retrieve the window object using the WINDOW property, and set the BACKGROUND_COLOR on the window object.
BACKGROUND_TRANSPARENCY
Set this property to an integer between 0 and 100 giving the percent transparency of the background color. The default is 100 (completely transparent).
If the BACKGROUND_COLOR property is changed and the current background transparency is 100, then the BACKGROUND_TRANSPARENCY will be automatically set to 0 (opaque) so that you can see the new color.
BORDER
Set to 1 to draw border lines around the bubbles, or to 0 to disable the border lines. The default is to draw the border lines.
CLIP
Set this property to 1 to clip portions of the graphic that lie outside of the dataspace range, or to 0 to disable clipping. The default is 1.
COLOR
An array of colors denoting the colors to use for each bubble, either a [3xN] element byte array, an N-element string array, or an array of indexes into the color table specified by RGB_TABLE. If the number of colors specified is less than the number of bubbles, the colors are repeated cyclically. If the number of colors specified is greater than the number of bubbles, only the first M colors will be used (where M is the number of bubbles plotted).
If COLOR contains exactly 3 elements it will be treated as a color triplet (i.e., [r, g, b]), as opposed to 3 color indices. To specify 3 color indices, repeat the values to create a 6 element vector (e.g., [ind1, ind2, ind3, ind1, ind2, ind3]).
CROSSHAIR (Get Only)
Use this property to retrieve a reference to the Crosshair graphic. All graphics objects within the same set of axes share a single Crosshair graphic. For Plot graphics the default behavior is to display the crosshair when a Mouse_Down event is received. For other graphics the crosshair is disabled. The STYLE property may be used to automatically draw the crosshair, while the LOCATION property may be used to manually draw the crosshair.
You can get and set the following properties on the retrieved crosshair:
|
Property |
Description |
|
ANTIALIAS |
Set to 1 to enable anti-aliasing for the lines.
|
|
COLOR |
A string or RGB vector containing the color.
|
|
HIDE |
Set to 1 to hide the crosshair, 0 to show.
|
|
INTERPOLATE |
Set to 1 to force interpolation between Plot data points when SNAP is active. For other graphics this property is ignored. The default is 0.
|
|
LINESTYLE |
An integer or string giving the line style. The default is 'dot'. See Linestyle Values for additional options.
|
|
LOCATION |
The location at which to draw the crosshair. For Plot graphics, if SNAP is enabled, then only the X coordinate needs to be supplied. Otherwise, LOCATION should be set to a two-element vector [X, Y] for two-dimensional graphics or [X, Y, Z] for three-dimensional graphics. If STYLE is currently "None", then setting the LOCATION will automatically set the STYLE to "Manual".
|
|
NAME |
The name of the graphic.
|
|
SNAP |
Set to 1 to snap the crosshair to the nearest Plot data point. For other graphics this property is ignored. The default is 1.
|
|
STYLE |
An integer or string giving the crosshair style. Possible values are:
0 - "None" - never draw the crosshair. This is the default for all graphics except 2D plots.
1 - "Manual" - draw the crosshair using the LOCATION property.
2 - "Auto" - automatically draw the crosshair. This is the default for 2D plots.
|
|
THICK |
The thickness of the lines. The default is 1.
|
|
TRANSPARENCY |
The percent transparency of the lines. The default is 50.
|
|
UVALUE |
An IDL variable of any data type.
|
For example, use the CROSSHAIR property to draw a crosshair on an image:
im = IMAGE(/TEST, TRANSPARENCY=50, AXIS_STYLE=2)
c = im.CROSSHAIR
c.COLOR = 'red'
c.THICK = 2
c.LOCATION = [300, 200]
See Creating Functions to Control Mouse Events for a more detailed crosshair example.
EXPONENT
Specify a value to use to convert the MAGNITUDE values to bubble radii. With the default value of 1 the bubble diameters will be directly proportional to the values in MAGNITUDE. An EXPONENT value of 0.5 will force the MAGNITUDE to be proportional to the bubble area instead of the diameter.
FILLED
Set this property to 1 to fill the bubbles. The default is to fill the bubbles.
FONT_COLOR
Set this property to a string or RGB vector that specifies the text color of the title and axes (if present). The default value is "black".
FONT_NAME
Set this property equal to a string specifying the IDL or system font for the title and axes (if present). The default value is "DejaVuSans".
FONT_SIZE
Set this property equal to an integer specifying the font size for the title and axes (if present). The default value is 9 points for the axis text and 11 points for the title.
FONT_STYLE
Set this property equal to an integer or a string specifying the font style for the title and axes (if present). Allowed values are:
|
Integer |
String |
Resulting Style |
|
0 |
"Normal" or "rm"
|
Default (roman) |
|
1 |
"Bold" or "bf" |
Bold |
|
2 |
"Italic" or "it"
|
Italic |
|
3 |
"Bold italic" or "bi"
|
Bold italic |
HIDE
Set this property to 1 to hide the graphic. Set HIDE to 0 to show the graphic.
LABEL_ALIGNMENT
Set LABEL_ALIGNMENT to a floating-point value between 0.0 and 1.0 to indicate the horizontal alignment of the label text. LABEL_ALIGNMENT specifies which side of the text lines up with the center point of the bubble.
A LABEL_ALIGNMENT of 0.0 left-justifies the text at the given position. Set the alignment to 1.0 to right-justify the text or to 0.5 (the default) to center the text.
LABEL_BASELINE
Set this property to a two- or three-element floating-point vector that specifies the direction to orient the labels' baselines. Use LABEL_BASELINE in conjunction with LABEL_UPDIR to specify the plane on which the text lies.
LABEL_FONT_COLOR
Set this property to a string or RGB vector that specifies the label text color. The default is "black".
LABEL_FONT_NAME
Use this property to specify a string indicating the name of the IDL or system font to use for the label text. The default value is "Helvetica".
LABEL_FONT_SIZE
Set this property to an integer or floating-point value giving the labels' font size in points. The default is 12.
LABEL_FONT_STYLE
An integer or string specifying the font style to be used for the text string.
LABEL_POSITION
An N-element string vector denoting the location of each label relative to the bubbles. Allowed values are "CENTER" (the default), "TOP", "BOTTOM", "RIGHT", or "LEFT". If the number of positions specified is less than the number of bubbles, the positions are repeated cyclically. If the number of positions specified is greater than the number of bubbles, only the first M positions will be used.
LABEL_UPDIR
Set this property to a two- or three-element floating-point vector to describe the vertical direction for the string. The upward direction is the direction defined by a vector pointing from the origin to the point specified.
Use LABEL_UPDIR in conjunction with LABEL_BASELINE to specify the plane on which the text lies (the direction specified by LABEL_UPDIR should be orthogonal to the direction specified by LABEL_BASELINE).
LABEL_VERTICAL_ALIGNMENT
Set this property to a floating-point value between 0.0 and 1.0 to indicate the vertical alignment of the label text baseline. LABEL_VERTICAL_ALIGNMENT specifies which side of the text lines up with the center point of the bubble.
An alignment of 0.0 bottom-justifies the text at the given position; an alignment of 1.0 top-justifies the text. The default is 0.5.
LABELS
Set LABELS to an N-element string vector denoting the text for the bubble labels. If the number of labels specified is greater than the number of bubbles, IDL only uses the first M labels (where M is the number of bubbles plotted).
LINECOLOR
Use this property to specify an array of colors, either a [3xN]-element byte array or an N-element string array, denoting the color to use for the border line of each bubble. If the number of colors specified is less than the number of bubbles, IDL repeats the colors cyclically during plotting. If the number of colors specified is greater than the number of bubbles, IDL only uses the first M colors (where M is the number of bubbles plotted).
LINESTYLE
Set this property to an integer or string specifying the line style for the border lines of all the bubbles. The default is a solid line.
Note: See Formatting IDL Graphic Symbols and Lines for a listing of available line styles.
LINETHICK
Set this property to a value between 0 and 10 that specifies the thickness of the border lines of all the bubbles. A thickness of 0 displays a thin hairline on the chosen device. The default value is 1.
MAGNITUDE
Set this property to a floating-point vector of equal length of Y to denote the size of each bubble. The values are scaled from 0 to the maximum value.
By default, IDL displays the bubble sizes specified in the MAGNITUDE keyword as proportional to diameters. The EXPONENT property allows you to change this default behavior to display bubble sizes proportional to the area instead.
MAX_VALUE
Use this property to specify a maximum value for scaling the MAGNITUDE. If not specified the maximum value of the MAGNITUDE values will be used. Use this property to ensure that bubbles of different datasets maintain consistent sizing.
NAME
A string that specifies the name of the graphic. The name can be used to retrieve the graphic using the brackets array notation. If NAME is not set then a default name is chosen based on the graphic type.
POSITION
Set this property to a four-element vector that determines the position of the graphic within the window. The coordinates [X1, Y1, X2, Y2] define the lower left and upper right corners of the graphic. Coordinates are expressed in normalized units ranging from 0.0 to 1.0.
After creation, you can set the POSITION to either a two or four-element vector. If you provide two elements, IDL translates the center of the graphic to that position. If you provide four elements, IDL translates and scales the graphic to fit the position.
RGB_TABLE
Set this property to the number of a predefined IDL color table, or a 3 x 256 or 256 x 3 byte array containing color values to use for the bubbles. Use the COLOR property to specify indices that select colors from the values specified with RGB_TABLE.
SHADED
If set, the bubbles will be filled with graduated color to simulate three-dimensional shading. The default is to fill the bubbles with a solid color.
SIZING
Set this property to a floating point value denoting the relative sizes of all of the bubbles. Increasing this value will increase the sizes of all the bubbles.
TITLE
Set this property to a string specifying a title. The title properties may be modified using FONT_COLOR, FONT_NAME, FONT_SIZE, and FONT_STYLE. After creation the TITLE property may be used to retrieve a reference to the title text object, and the TEXT properties may be used to modify the title object.
You can add Greek letters and mathematical symbols using a TeX-like syntax, enclosed within a pair of "$" characters. See Adding Mathematical Symbols and Greek Letters to the Text String for details.
UVALUE
Set this property to an IDL variable of any data type.
WINDOW (Get Only)
This property retrieves a reference to the WINDOW object which contains the graphic.
WINDOW_TITLE
Set this property to the title of the IDL Graphic window. The title is displayed in the window's title bar.
XRANGE
A two-element vector giving the X data range to plot. The default behavior is to plot the entire data range.
YRANGE
A two-element vector giving the Y data range to plot. The default behavior is to plot the entire data range.
Additional Examples
Example 2 - Label Alignments
This example demonstrates how to specify label alignments using LABEL_ALIGNMENT and LABEL_VERTICAL_ALIGNMENT.
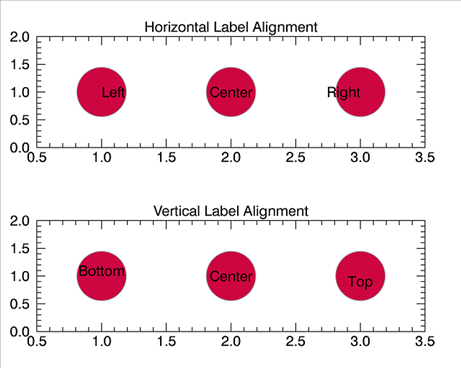
Paste the following code to the IDL command line to create the above plot.
x = [1,2,3]
y = [1,1,1]
label_h_align = ['Left','Center','Right']
bp1 = BUBBLEPLOT(x, y, TITLE='Horizontal Label Alignment', $
LABELS=label_h_align, LABEL_ALIGNMENT=[0,0.5,1.0], $
LAYOUT=[1,2,1])
label_v_align = ['Bottom','Center','Top']
bp2 = BUBBLEPLOT(x, y, TITLE='Vertical Label Alignment', $
LABELS=label_v_align, LABEL_VERTICAL_ALIGNMENT=[0,0.5,1.0], $
LAYOUT=[1,2,2], /CURRENT)
Example 3 - Label Positions
This example demonstrates how to specify label positions using LABEL_POSITION. Note the different results from the previous example.
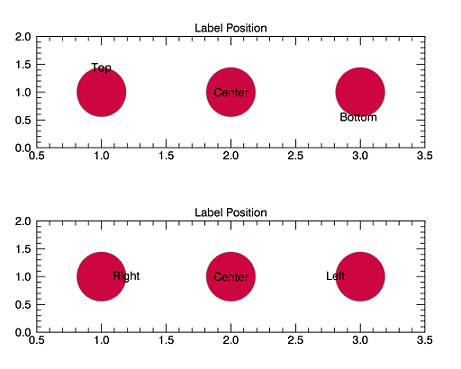
Paste the following code at the IDL command line to generate the plot above.
x = [1,2,3]
y = [1,1,1]
label_pos = ['Top','Center','Bottom']
bp3 = BUBBLEPLOT(x, y, TITLE='Label Position', $
LABELS=label_pos, LABEL_POSITION=label_pos, $
LAYOUT=[1,2,1])
label_pos2 = ['Right','Center','Left']
bp4 = BUBBLEPLOT(x, y, TITLE='Label Position', $
LABELS=label_pos2, LABEL_POSITION=label_pos2, $
LAYOUT=[1,2,2], /CURRENT)
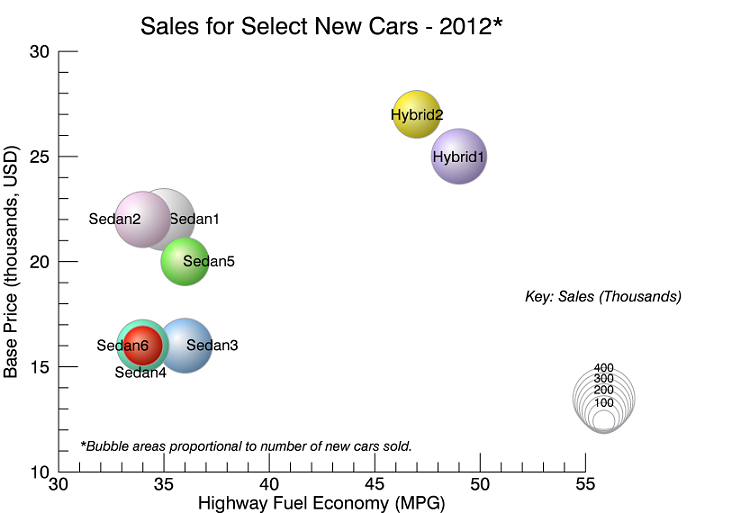
Example 4 - Use a Color Table and Create a Key
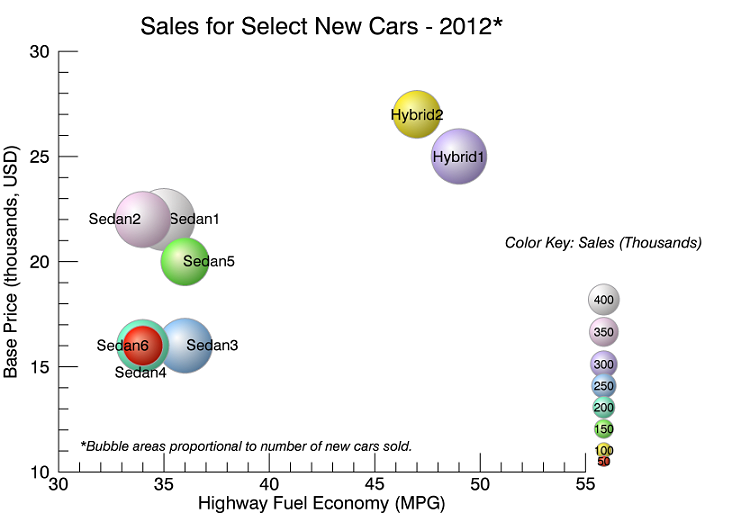
This example also uses the new car sales data but colors the bubbles using RGB_TABLE and COLOR, rather than specifying the bubble colors manually. Using the color table emphasizes the scaling of the bubbles (representing sales in thousands). Note that in this example, the bubble sizes in the key are not tied to the bubble sizes in the source plot - this is to enhance readability of the final graphic.
The key in this example exists in a separate dataspace from the main BUBBLEPLOT (note the use of the LAYOUT keyword).
To create a key with colors and sizes reflecting the original plot, create the key in the same dataspace as the original by using the /OVERPLOT keyword, and remove LOCATION. Also make sure to use the same values for EXPONENT, SIZING, and MAX_VALUE in the key as in the original. You can easily do this by referencing the original plot in a property's declaration inside of a call to BUBBLEPLOT. Here is an example with the SIZING property:
SIZING=origPlot.SIZING
Copy and paste the following code to the IDL command line to create the graphic above.
sales = [405,332,326,318,291,246,241,170]
price = [22,22,25,16,16,20,27,16]
MPG = [35,34,49,36,34,36,47,34]
cars = ['Sedan1','Sedan2','Hybrid1','Sedan3','Sedan4','Sedan5', $
'Hybrid2','Sedan6']
indices = [50,100,150,200,250,300,350,400]
locations2 = ['right','left','center','right','bottom','right', $
'center','left']
BP5 = BUBBLEPLOT(MPG, price, Magnitude=Sales, $
DIMENSIONS=[700,500], $
YTITLE='Base Price (thousands, USD)', $
XTITLE='Highway Fuel Economy (MPG)', $
LABELS=cars, LABEL_FONT_SIZE=10, COLOR=BYTSCL(indices), $
RGB_TABLE=22, /SHADED, LABEL_POSITION=locations2, $
EXPONENT=.5, TITLE='Sales for Select New Cars - 2012*', $
LAYOUT=[2,1,1], POSITION=[0.08,0.08,0.8,0.9])
BP5['axis2'].HIDE = 1
BP5['axis3'].HIDE = 1
carText = TEXT(31, 11, TARGET=BP5, $
'*Bubble areas proportional to number of new cars sold.', $
/DATA, COLOR='black', FONT_SIZE=9, FONT_STYLE='italic')
BP5.TITLE.FONT_SIZE = 16
x = [50,50,50,50,50,50,50,50]
y = [1,2,4,6,8,10,13,16]
bSizes = [50,100,150,200,250,300,350,400]
bLabels = ['50','100','150','200','250','300','350','400']
myKey = BUBBLEPLOT(x, y, MAGNITUDE=bSizes, sizing=0.5, $
EXPONENT=.5, /CURRENT, AXIS_STYLE=0, LABELS=bLabels, $
LABEL_FONT_SIZE=8, FONT_SIZE=10, FONT_STYLE='italic', $
TITLE='Color Key: Sales (Thousands)', $
RGB_TABLE=BP5.RGB_TABLE, COLOR=BYTSCL(indices), /SHADED, $
LAYOUT=[2,1,2], POSITION=[0.7,0.08,0.95,0.5], YRANGE=[0,20])
x2 = [50, 50, 50, 50, 50, 50, 50, 50]
y2 = [6,6.4,6.8,7.2,7.6,8,8.4,8.8]
bSizes = [50,100,150,200,250,300,350,400]
bLabels = ['','100','','200','','300','','400']
myKey2 = BUBBLEPLOT(x2, y2, MAGNITUDE=bSizes, $
EXPONENT=.5, /CURRENT, AXIS_STYLE=0, LABELS=bLabels, $
FILLED=0, LABEL_FONT_SIZE=8, $
TITLE='Key: Sales (Thousands)', $
FONT_SIZE=10, FONT_STYLE='italic', $
LABEL_POSITION='top', LAYOUT=[2,1,2], $
MAX_VALUE=BP5.MAX_VALUE, $
POSITION=[0.7,0.1,0.95,0.4], YRANGE=[1,20])
An alternate key (see code for KEY STYLE 2, above):
Version History
| 8.2.3 |
Introduced |
| 8.6 |
Changed default font name and font size. |
See Also
!COLOR, BARPLOT,
Bubbleplots, ERRORPLOT, Formatting IDL Graphics Symbols and Lines, Graphics Window Interface,
LEGEND,
PLOT3D, PLOT,
POLARPLOT, SCATTERPLOT3D,
Using IDL graphics