The ARROW function draws an arrow or multiple arrows between points.
Tip: The ARROW function draws arrows from one (X, Y) location to another (X, Y) location, either as an annotation or within the data space. The VECTOR function may be used to draw a vector field or wind field (in arbitrary units) at a series of (X, Y) locations.
Example
Using the ARROW function, display a route through Reykjavik.
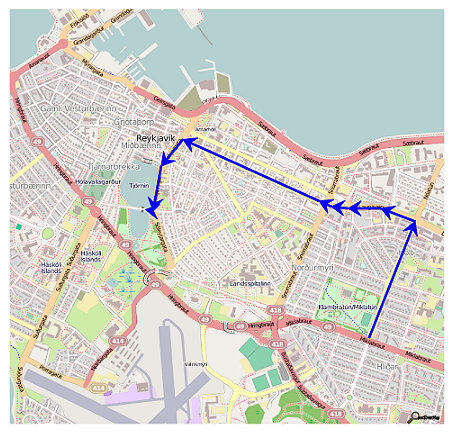
im = FILEPATH('reykjavik.png', $
SUBDIR=['examples', 'data'])
READ_PNG, im, myImage
y = IMAGE(myImage)
a1 = ARROW([579,653], [139,326], COLOR='blue', /DATA, /CURRENT)
a2 = ARROW([653,598], [326,347], COLOR='blue', /DATA, /CURRENT)
a3 = ARROW([598,545], [347,347], COLOR='blue', /DATA, /CURRENT)
a4 = ARROW([545,518], [347,350], COLOR='blue', /DATA, /CURRENT)
a5 = ARROW([518,498], [350,359], COLOR='blue', /DATA, /CURRENT)
a6 = ARROW([498,279], [359,458], COLOR='blue', /DATA, /CURRENT)
a7 = ARROW([279,244], [458,415], COLOR='blue', /DATA, /CURRENT)
a8 = ARROW([244,231], [415,343], COLOR='blue', /DATA, /CURRENT)
a9 = ARROW([231,219], [343,345], COLOR='blue', /DATA, /CURRENT)
a1.thick=2
a2.thick=2
a3.thick=2
a4.thick=2
a5.thick=2
a6.thick=2
a7.thick=2
a8.thick=2
a9.thick=2
Additional Examples
See Additional Examples and Annotations Examples for additional examples using the ARROW function.
Syntax
graphic = ARROW(X, Y, [, Keywords=value] [, Properties=value])
Keywords
Keywords are applied only during the initial creation of the graphic.
Properties
Properties can be set as keywords to the function during creation, or retrieved or changed using the "." notation after creation.
Methods
Close
ConvertCoord
CopyWindow
Delete
Erase
GenerateCode
GetData
GetValueAtLocation
MapForward
MapInverse
Order
Print
Refresh
Rotate
Save
Scale
Select
SetData
Translate
Note: The GetValueAtLocation method is not supported for ARROW.
Return Value
The ARROW function returns a reference to the created annotation. Use the returned reference to manipulate the annotation after creation by changing properties or by calling methods.
Arguments
X
A two-element vector [xstart, xend] containing the x-coordinates for the arrow. By default, the coordinates are in normalized units (between 0 and 1). To draw multiple arrows, X can also be set to a 2 x N array, where each two-element row contains the [xstart, xend] coordinates for that arrow. In this case, Y should also be set to a 2 x N array.
Y
A two-element vector [ystart, yend] containing the y-coordinates for the arrow. By default, the coordinates are in normalized units (between 0 and 1). To draw multiple arrows, Y can also be set to a 2 x N array, where each two-element row contains the [ystart, yend] coordinates for that arrow. In this case, X should also be set to a 2 x N array.
Keywords
Keywords are applied only during the initial creation of the graphic.
DATA
Set this keyword to 1 if the input arguments are specified in data coordinates. Setting this keyword inserts the arrow into the data space. Otherwise, the arrow is added to the annotation layer.
If the arrow head extends beyond the data range, the arrow will not be drawn. For double-headed arrows, if either arrow head extends beyond the data range, the arrow will not be drawn.
DEVICE
Set this keyword if the x and y coordinates are specified in device coordinates (pixels).
NORMAL
Set this keyword to 1 if the input arguments are specified in normalized (0, 1) coordinates (this is the default behavior).
RELATIVE
Set this keyword to indicate that the input arguments are specified in normalized [0,1] coordinates, relative to the axis range of the TARGET's dataspace. If the TARGET keyword is not specified, then setting /RELATIVE is the same as setting /NORMAL.
When using /RELATIVE, even though the coordinates are relative to the TARGET's dataspace, the graphic is added to the annotation layer, not to the dataspace.
TARGET
If points are specified in data coordinates, set this keyword to the graphic object in which to insert the arrow. By default, the current graphic is used.
Properties
ANTIALIAS
By default, anti-aliasing is used when drawing lines. Set this property to 0 to disable anti-aliasing.
ARROW_STYLE
Set this property to an integer specifying the style or arrow used. The valid values are:
|
Value |
Arrow Style |
|
1 |
-------> (default)
|
|
2 |
<------- |
|
3 |
<------> |
|
4 |
>------> |
|
5 |
<------< |
If you pass an invalid value, the ARROW_STYLE is set to 1 (the default value).
CLIP
Set this property to 1 to clip portions of the arrow that lie outside of the dataspace range, or to 0 to disable clipping. The default is 1. This property is ignored unless the DATA property is set.
COLOR
Set this property to a string or RGB vector that specifies the arrow color. The default value is "black". If you are drawing multiple arrows (X and Y are 2 x N arrays) then COLOR can be set to either an N-element string array of color names, or to a 3 x N byte array where each row contains the 3-element RGB color for that arrow. If there are less colors than arrows, then the colors are cyclically repeated. If there is only a single color, then all arrows will have the same color.
FILL_BACKGROUND
Set this property to 1 to fill the arrow (the default behavior). A value of 0 draws the arrow as an outline.
FILL_COLOR
Set this property to a string or RGB vector that specifies the arrow fill color. The default behavior is to match the COLOR property. If you are drawing multiple arrows (X and Y are 2 x N arrays) then FILL_COLOR can be set to either an N-element string array of color names, or to a 3 x N byte array where each row contains the 3-element RGB fill color for that arrow. If there are less colors than arrows, then the colors are cyclically repeated. If there is only a single fill color, then all arrows will have the same fill color.
If you set the FILL_COLOR property to a scalar number (with any value), then the FILL_COLOR will be reset so that it again matches the COLOR property.
FILL_TRANSPARENCY
Set this property to an integer between 0 and 100 that specifies the percent transparency of the arrow interior.
The default value is the same as the TRANSPARENCY property value.
HEAD_ANGLE
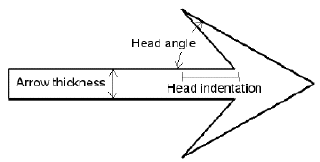
Set this property to a floating-point value between 0 and 90 that specifies the angle (in degrees) between the arrowhead and the shaft. The default value is 30.
HEAD_INDENT
Set this property to a floating-point value between -1 and 1 that specifies the indentation of the back of the arrowhead along the shaft.
A value of 0 gives a triangular shape. A value of 1 draws an arrowhead composed of two lines. A value of -1 creates a diamond-shaped arrowhead. The default value is 0.4.
HEAD_SIZE
Set this property to a floating-point factor used to scale the arrow heads. The default value is 1. If you are drawing multiple arrows (X and Y are 2 x N arrays) then HEAD_SIZE can be set to an array of head sizes. If there are less elements than arrows, then the head sizes are cyclically repeated. If there is only a single HEAD_SIZE value, then all arrows will have the same head size.
HIDE
Set this property to 1 to hide the arrow. A value of 0 reveals the arrow (the default behavior).
LINESTYLE
Set this property to an integer or string specifying the line style for the polyline.
The following table lists the index values, strings, and characters you can use with the LINESTYLE property, and the equivalent characters and strings you can use in the Format string argument.
|
Index |
LINESTYLE Property
|
Format Argument |
Description |
|
0 |
'solid_line', '-'(dash)
|
'-' (dash) |
solid line |
|
1 |
'dot', ':'(colon)
|
':'(colon) |
dotted |
|
2 |
'dash', '--' (double dashes)
|
'--' (double dashes)
|
dashed |
|
3 |
'dash_dot', '-.'
|
'-.' |
dash dot |
|
4 |
'dash_dot_dot_dot', '-:'
|
'-:' |
dash dot dot dot
|
|
5 |
'long_dash', '__' (two underscores)
|
'__' (double underscores)
|
long dash |
|
6 |
'none', ' ' (space)
|
' ' (space) |
no line |
Note: If you use the LINESTYLE value or Format string '-.', the linestyle is set to dash-dot and the plot symbol is not set.
Note: You can also set LINESTYLE to a two-element vector, [repeat, bitmask], specifying a stippling pattern. The repeat indicates the number of times that individual bits in the bitmask should be repeated. (That is, if three consecutive 0’s appear in the bitmask and the value of repeat is 2, then the line that is drawn will have six consecutive bits turned off.) The value of repeat must be an integer between 1 and 255. The bitmask indicates which pixels are drawn and which are not along the length of the line. The bitmask should be specified as a 16-bit hexadecimal value. For example, LINESTYLE = [2, 'F0F0'X] describes a dashed line (8 bits on, 8 bits off, 8 bits on, 8 bits off).
LINE_THICK
Set this property to a value between 0 and 10 specifying the thickness of the arrow outline. The default value is 1.
NAME
Set this property to a string that specifies the name of the graphic. The name can be used to retrieve the graphic using the bracket array notation. If NAME is not set, IDL assigns a name based on the graphic type.
POSITION
Set this property to a two or four-element vector that determines the position of the graphic within the window. If two elements are provided, the center of the graphic will be translated to that position. For four elements, the coordinates [X1, Y1, X2, Y2] define the lower left and upper right corners of the graphic. Coordinates are expressed in normalized units ranging from 0.0 to 1.0. On creation, if the DEVICE keyword is set, the units are given in device units (pixels).
THICK
Set this property to a floating-point value between 1 and 10 that specifies the thickness of the arrow shaft. The default value is 1. If you are drawing multiple arrows (X and Y are 2 x N arrays) then THICK can be set to an array of thicknesses. If there are less elements than arrows, then the thickness values are cyclically repeated. If there is only a single THICK value, then all arrows will have the same thickness.
TRANSPARENCY
Set this property to an integer between 0 and 100 that specifies the percent transparency of the arrow. The default value is 0.
UVALUE
Set this property to an IDL variable of any data type.
WINDOW (Get Only)
This property retrieves a reference to the WINDOW object which contains the graphic.
Additional Examples
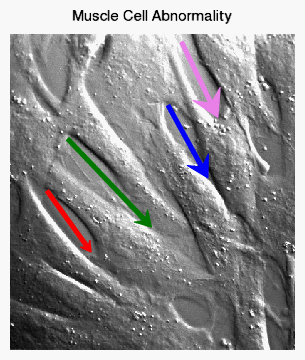
The following code creates an image with four arrows, each with a different color and arrow head size.
im = IMAGE(FILEPATH('muscle.jpg', $
SUBDIRECTORY=['examples','data']), $
  TITLE='Muscle Cell Abnormality', $
  XRANGE=[0,400])
xcoord = [[52,114], [81,199], [222,278], [241,292]]
ycoord = [[224,138], [297,173], [344,242], [433,327]]
arrows = ARROW(xcoord, ycoord, /DATA, $
COLOR=['red','green','blue','violet'], $
THICK=4, HEAD_SIZE=[1,1.5,2,2.5])
Version History
|
8.0.1 |
Introduced |
|
8.1 |
Added the following properties: UVALUE.
The LINE_THICK property was changed to accept a value between 0 and 10.
Added the following methods: Delete, GetData, SetData.
|
|
8.2 |
Added support for multiple arrows to the X and Y arguments, and to COLOR, FILL_COLOR, HEAD_SIZE, THICK.
|
|
8.2.2 |
Added POSITION property.
|
| 9.0 |
Added LINESTYLE property. |
See Also
!COLOR, POLYLINE, POLYGON, VECTOR, Using IDL Graphics