The FFT_POWERSPECTRUM function computes the one-sided power spectral density (Fourier power spectrum) of an array.
For a given input signal array, the power spectrum computes the portion of a signal's power (energy per unit time) falling within given frequency bins. The power is calculated as the average of the squared signal. In the frequency domain, this is the square of the FFT's magnitude.
Notes
- The Fourier amplitude A is computed as twice the absolute value of the Fourier transform F, since positive and negative frequencies will have the same amplitude. For a sine wave of amplitude 1 this will return a peak Fourier amplitude of 1.
- The power spectrum is computed as A2/2. For a sine wave of amplitude 1 this will return a peak power of 0.5.
- The total power (excluding the zero-frequency term) will then be equal to the variance of the array (except for a factor of (N-1)/N where N is the number of points).
- If N is even then the last element (at the Nyquist frequency) will have a Fourier amplitude A = √2F, which gives a power A2/2 = F2. This is because for even-length signals the Nyquist frequency only occurs once in the Fourier transform.
This routine is written in the IDL language. Its source code can be found in the file fft_powerspectrum.pro in the lib subdirectory of the IDL distribution.
Example
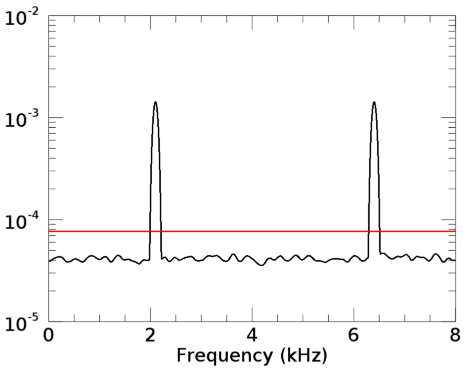
This example plots the power spectrum of a noisy sinusoidal signal with two specified frequency components.
dt = 1/16000.
t = [0:3:dt]
freq1 = 2100
freq2 = 6400
x = cos(2*!pi*t * freq1)+ sin(2*!pi*t * freq2)
x += randomn(seed, t.length)
f = FFT_PowerSpectrum(x, dt, FREQ=freq, $
/TUKEY, WIDTH=0.01, SIGNIFICANCE=signif)
p = PLOT(freq/1000, f, /YLOG, XTITLE='Frequency (kHz)')
p1 = PLOT(freq/1000, signif, '2r', /OVERPLOT)
IDL produces the following plot:
Syntax
Result = FFT_POWERSPECTRUM(Input [, dt])
Return Value
If Input is an N-element array, Result is a vector of length N/2 + 1.
If Input is a double, Result is a double vector containing the computed values. Otherwise Result is a float vector.
Arguments
Input
A vector of time series values, of length N.
dt
The time interval between measurements. If not supplied a default value of 1.0 is used.
Keywords
AMP
If set to a named variable, this keyword will contain a vector of length N/2 + 1 containing the Fourier amplitude.
BANDWIDTH
If set to a named variable, this keyword will contain the width of the Tukey smoothing filter, in units of frequency. If TUKEY is not set, this keyword has no effect.
DOF
If set to a named variable, this keyword will contain the degrees of freedom for the chi-square distribution for the significances. If TUKEY smoothing is not used, this value is 2.0. If TUKEY smoothing is used, the value is 2*N*BANDWIDTH.
FRACTION
If this keyword is set, return the fractional power spectral density; calculated as Result/TOTAL(Result).
FREQ
If set to a named variable, this keyword will contain a vector of the frequencies at which the power spectral density is evaluated.
LAG
The autocorrelation lag value used when calculating significance values. If not supplied a default value of 0.0 is used. If SIGNIFICANCE is not used, this keyword has no effect.
PERIOD
If set to a named variable, this keyword will contain a vector of the periodic components at which the power spectral density is evaluated. Period[n] = 1/Freq[n]
PHASE
If set to a named variable, this keyword will contain a vector of length N/2 + 1 containing the Fourier phase.
SIG_LEVEL
The significance level used when calculating significance values. If not supplied a default value of 0.05 (5%) is used. If SIGNIFICANCE is not used, this keyword has no effect.
SIGNIFICANCE
If set to a named variable, this keyword will contain a vector of length N/2 + 1 containing the significance levels as a function of FREQ. The default 5% significance level (95% confidence level) implies that for a random time series, 5% of the points will, by chance, be above that threshold.
TUKEY
If this keyword is set, smooth the result using a Tukey filter. The default is no smoothing.
WIDTH
The effective width of the Tukey filter, as a fraction of the number of points N. If not supplied a default value of 0.02 is used. If TUKEY is not set, this keyword has no effect.
Version History
See Also
FFT, A_CORRELATE