The MAPCONTINENTS function overlays map boundaries on a map in a graphics window. By default the function draws the continental outlines.
Example
The following lines create the map shown at right: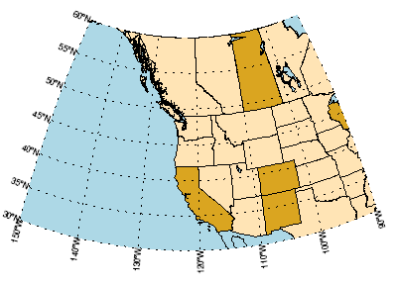
map = MAP('Orthographic', $
LIMIT = [30, -150, 60, -90], $
CENTER_LATITUDE = 48, $
CENTER_LONGITUDE = -122, $
FILL_COLOR = "light blue")
grid = map.MAPGRID
grid.LINESTYLE = "dotted"
grid.LABEL_POSITION = 0
grid.FONT_SIZE = 14
m1 = MAPCONTINENTS()
m2 = MAPCONTINENTS(/USA, COMBINE = 0, $
FILL_COLOR = "MOCCASIN")
m3 = MAPCONTINENTS(/CANADA, COMBINE = 0, $
FILL_COLOR = "MOCCASIN")
m4 = MAPCONTINENTS(/LAKES, FILL_COLOR="light blue")
cstates = MAP['USA/*C*']
FOREACH c,cstates DO c.FILL_COLOR="goldenrod"
MAP['Saskatchewan'].FILL_COLOR = "goldenrod"
Additional Examples
See Map examples for additional examples using the MAPCONTINENTS function.
Syntax
graphic = MAPCONTINENTS( [Filename] [, Keywords=value] [, Properties=value])
Keywords
Keywords are applied only during the initial creation of the graphic.
[, /CANADA] [, COMBINE=0] [, /CONTINENTS] [, /COUNTRIES] [, /DEVICE] [, /HIRES] [, /ISLANDS] [, /LAKES] [, /LEGACY] [, LIMIT=array] [, /NOCLIP] [, /RIVERS] [, /USA]
Properties
Properties can be set as keywords to the function during creation, or retrieved or changed using the "." notation after creation.
ANTIALIAS, CLIP, COLOR, FILL_BACKGROUND, FILL_COLOR, HIDE, LINESTYLE, NAME, THICK, TRANSPARENCY, UVALUE, WINDOW
Methods
Close
ConvertCoord
CopyWindow
Delete
Erase
Order
Print
Refresh
Rotate
Save
Scale
Select
Translate
MapForward
MapInverse
Return Value
The MAPCONTINENTS function returns a reference to the MapContinents object. Use the returned reference to manipulate the graphic after creation by changing properties or calling methods.
Arguments
Filename
An optional argument giving the name of a shapefile. If this argument is present, then the file will be read and graphics objects will be created for the contained shapes.
Keywords
Keywords are applied only during the initial creation of the graphic.
CANADA
Set this keyword to draw the outlines of the Canadian provinces. This keyword is ignored if Filename is used, or if any other keywords (such as CONTINENTS, etc) are used.
COMBINE
By default all of the outlines are combined into a single polygon (COMBINE=1). Set this property to 0 to create each outline as a separate object. This is slower to draw, but allows each individual outline to be retrieved and modified. See the example above for the use of COMBINE=0.
CONTINENTS
Set this keyword to draw continental outlines. This is the default behavior for MAPCONTINENTS if no other keywords (like /CANADA, /USA, etc.) are passed in, and is provided only for completeness. This keyword is ignored if Filename is used, or if any other keywords (such as COUNTRIES, etc) are used.
Note: Use the HIRES property in conjunction with the CONTINENTS keyword to draw high-resolution continental outlines.
Note: See below for details on Data Sources.
COUNTRIES
Set this keyword to draw the country outlines. This keyword is ignored if Filename is used, or if any other keywords (such as CONTINENTS, etc) are used.
Note: See below for details on Data Sources.
HIRES
Set this keyword to use high-resolution data. This keyword applies to the CONTINENTS, LAKES, RIVERS, and USA keywords.
Note: Creating a high-resolution map of a large area is a resource-intensive (slow) process. It is recommended that you only use the HIRES keyword for relatively small regions of the globe.
ISLANDS
Set this keyword to draw the outlines of major islands within lakes. This keyword is ignored if Filename is used, or if any other keywords (such as CONTINENTS, etc) are used.
LAKES
Set this keyword to draw the outlines of major world lakes. This keyword is ignored if Filename is used, or if any other keywords (such as CONTINENTS, etc) are used.
Note: Use the HIRES property in conjunction with the LAKES keyword to draw high-resolution lake outline.
LEGACY
By default, MAPCONTINENTS uses the most up-to-date data for continental and country boundaries. Set this keyword to use the older shapefiles from IDL 9.0 and earlier. This keyword can only be combined with the CONTINENTS and COUNTRIES keywords, and is ignored for the other shapefiles.
Note: See below for details on Data Sources.
LIMIT
Set this keyword to a four-element vector of the form [Latmin, Lonmin, Latmax, Lonmax] that specifies the boundaries of the clipping region. Shapes that lie outside of these limits will not be drawn. If the NOCLIP keyword is set, then the LIMIT property is ignored.
Note: The default behavior is to use the limits of the current map projection for clipping. You only need to set the LIMIT keyword if you intend to change the map limits later, and you want to ensure that all of the shapes will still be drawn.
NOCLIP
By default the MAPCONTINENTS function does not include shapes whose boundaries lie outside of the current map limits (or the value of the LIMIT property). If you later modify the map limit, these excluded shapes will appear to be missing. If you set the NOCLIP keyword to 1, then all of the shapes will be included in the map, even if they lie completely outside of the map limits.
RIVERS
Set this keyword to draw lines representing the major world rivers. The FILL_BACKGROUND and FILL_COLOR properties are ignored for this case. This keyword is ignored if Filename is used, or if any other keywords (such as CONTINENTS, etc) are used.
Note: Use the HIRES property in conjunction with the RIVERS keyword to draw high-resolution river lines.
USA
Set this keyword to draw the outlines of the United States. This keyword is ignored if Filename is used, or if any other keywords (such as CONTINENTS, etc) are used.
Note: Use the HIRES property in conjunction with the USA property to draw high-resolution state outlines.
Properties
ANTIALIAS
By default anti-aliasing is used when drawing lines. Set this property to 0 to disable anti-aliasing.
CLIP
Set this property to 1 to clip portions of the graphic that lie outside of the dataspace range, or to 0 to disable clipping. The default is 1.
COLOR
Set this property to a string or RGB vector that specifies the color of the outlines. The default is "black".
FILL_BACKGROUND
Set this property to 1 to fill the outlines, or to 0 to turn off the fill.
FILL_COLOR
Set this property to a string or RGB vector that specifies the fill color. If this property is specified then FILL_BACKGROUND is automatically turned on.
HIDE
Set this property to 1 to hide the graphic, or 0 to show the graphic.
LINESTYLE
Set this property to an integer or string specifying the line style for the outline.
The following table lists the index values and strings you can use with this property.
|
Index |
Property |
Description |
|
0 |
'solid_line', '-'(dash)
|
solid line |
|
1 |
'dot', ':'(colon)
|
dotted |
|
2 |
'dash', '--' (double dashes)
|
dashed |
|
3 |
'dash_dot', '-.'
|
dash dot |
|
4 |
'dash_dot_dot_dot', '-:'
|
dash dot dot dot
|
|
5 |
'long_dash', '__' (two underscores)
|
long dash |
|
6 |
'none', ' ' (space)
|
no line |
You can also set the line style to a two-element vector, [repeat, bitmask], specifying a stippling pattern. The repeat indicates the number of times that individual bits in the bitmask should be repeated. (That is, if three consecutive 0’s appear in the bitmask and the value of repeat is 2, then the line that is drawn will have six consecutive bits turned off.) The value of repeat must be an integer between 1 and 255. The bitmask indicates which pixels are drawn and which are not along the length of the line. The bitmask should be specified as a 16-bit hexadecimal value. For example, [2, 'AAAA'X] describes a dashed line with very short dashes of length 2 bits each.
NAME
A string that specifies the name of the graphic. The name can be used to retrieve the graphic using the brackets array notation. If NAME is not set then a default name is chosen based on the graphic type.
THICK
Set this property to a value between 0 and 10 that specifies the thickness of the outlines. A thickness of 0 displays a thin hairline on the chosen device. The default value is 1.
TRANSPARENCY
An integer between 0 and 100 that specifies the percent transparency of the objects. The default value is 0.
UVALUE
Set this property to an IDL variable of any data type.
WINDOW (Get Only)
This property retrieves a reference to the WINDOW object which contains the graphic.
Data Sources
Data for continents, islands, and lakes is taken from the GSHHG datasets, with slight modifications to remove tiny polygons and to include Antarctica in the continents file. The river data is taken from the WDBII full-resolution dataset by combining the three major-river files. These datasets are used with the permission of the authors, Paul Wessel (SOEST, University of Hawai'i) and Walter H. F. Smith (NOAA Geosciences Lab, National Ocean Service). Version information can be found in the readme file within the resource/maps/shape directory in the installation.
Country boundaries are taken from the World Bank Official Boundaries, downloaded January 2023 from the World Bank Data Catalog. The dataset is licensed under a Creative Commons Attribution 4.0 license. Country boundaries are current as of 19 March 2020. The following changes were made to the downloaded shapefile:
-
Added territory boundary for Western Sahara;
-
Added country boundaries within the Caspian Sea for the five countries on the border;
-
Added territory boundaries for missing polygons within Africa and Asia.
Tip: If you require more up-to-date country boundaries, it is recommended that you locate and download your desired shapefile, and then use the Filename keyword to override the default.
Version History
|
8.0 |
Introduced |
|
8.1 |
Added the UVALUE property and the HIRES keyword
Added the following methods:: Delete, MapForward, MapInverse
|
|
8.2.3 |
Added the ability to use a stippling pattern for LINESTYLE.
|
| 9.1 |
Updated shapefiles for continents, countries. Added shapefiles for islands, hi-res lakes, hi-res rivers. Added ISLANDS and LEGACY keywords. |
See Also
!COLOR, MAP,
MAPGRID, IDL Graphics Functions, Using IDL graphics