The SYMBOL function adds a symbol or multiple symbols (with optional text labels) to the current IDL graphic.
Example
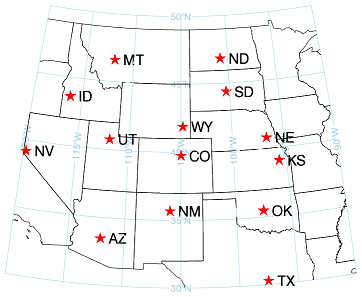
This example draws a map of the western United States with the state capitals.
Note: The symbol location is specified with lon/lat coordinates, and is automatically transformed to the map projection of the data space.
m = MAP('Orthographic', COLOR='light blue', $
LIMIT=[30, -120, 50, -90], $
CENTER_LONGITUDE=-105, CENTER_LATITUDE=40)
c = MAPCONTINENTS(/USA)
m.mapgrid.ORDER, /SEND_TO_BACK
lon = [-104.98,-104.80,-111.88,-116.22,-112.03, $
-119.75,-100.78,-100.34,-96.68,-95.69, $
-97.54,-97.53,-105.97,-112.07]
lat = [39.74,41.87,40.75,43.61,46.60, $
39.16,46.82,44.37,40.81,39.06, $
35.48,30.27,35.67,33.45]
labels = ['CO','WY','UT','ID','MT','NV','ND', $
'SD','NE','KS','OK','TX','NM','AZ']
capitals = SYMBOL( lon, lat, 'Star', /DATA, $
/SYM_FILLED, SYM_COLOR='red', SYM_SIZE = 2, $
LABEL_STRING=labels )
Additional Examples
See Additional Examples for more examples using the SYMBOL function.
Syntax
Result = SYMBOL(X, Y [, Symbol] [, Keywords=value] [, Properties=value])
Keywords
Keywords are applied only during the initial creation of the graphic.
[, /DATA] [, /DEVICE] [, /NORMAL] [, /RELATIVE] [, TARGET=variable]
Properties
Properties can be set as keywords to the function during creation, or retrieved or changed using the "." notation after creation.
CLIP, HIDE, LABEL_COLOR, LABEL_FILL_BACKGROUND, LABEL_FILL_COLOR, LABEL_FONT_NAME, LABEL_FONT_SIZE, LABEL_FONT_STYLE, LABEL_ORIENTATION, LABEL_POSITION, LABEL_SHIFT, LABEL_STRING, LABEL_TRANSPARENCY, LINESTYLE, LINE_COLOR, LINE_THICK, POSITION, SYM_COLOR, SYM_FILLED, SYM_FILL_COLOR, SYM_FONT_FILL_BACKGROUND, SYM_FONT_FILL_COLOR, SYM_FONT_NAME, SYM_FONT_SIZE, SYM_FONT_STYLE, SYM_ROTATE, SYM_SIZE, SYM_TEXT, SYM_THICK, SYM_TRANSPARENCY, SYMBOL, UVALUE, WINDOW
Methods
Close
ConvertCoord
CopyWindow
Delete
Erase
Order
Print
Refresh
Rotate
Save
Scale
Select
Translate
Note: The Scale method is not available for SYMBOL. To resize or scale a symbol, use the SYM_SIZE or SYM_FONT_SIZE properties.
Return Value
Returns a reference to the created symbol. Use the reference to manipulate the symbol after creation by changing properties or calling methods.
Arguments
X
A scalar or array of x locations where the symbols will be placed. The x coordinates may be specified in data, normal (the default), or device coordinates.
Y
A scalar or array of y locations where the symbols will be placed. The y coordinates may be specified in data, normal (the default), or device coordinates.
Symbol
An optional scalar string giving the symbol name. See Plot Symbol Values for a list of valid symbol strings. Use the Symbol argument when creating a graphic symbol. Use the SYMBOL property to modify a previously-created symbol.
If the SYM_TEXT property is set, then the Symbol argument is ignored.
Keywords
Keywords are applied only during the initial creation of the graphic.
DATA
Set this keyword to 1 if the input arguments are specified in data coordinates. Setting this keyword inserts the symbol into the data space. Otherwise, the symbol is added to the annotation layer.
If the data space has a map projection, the X and Y arguments are automatically transformed to the projection.
DEVICE
Set this keyword if the X and Y coordinates are specified in device coordinates (pixels).
NORMAL
Set this keyword if the input arguments are specified in normalized (0, 1) coordinates (the default coordinate system).
RELATIVE
Set this keyword to indicate that the input arguments are specified in normalized [0,1] coordinates, relative to the axis range of the TARGET's dataspace. If the TARGET keyword is not specified, then setting /RELATIVE is the same as setting /NORMAL.
Note: When using /RELATIVE, even though the coordinates are relative to the TARGET's dataspace, the graphic is added to the annotation layer, not to the dataspace.
TARGET
If points are specified in data coordinates, set this keyword to the graphic object in which to insert the symbol. By default, the current graphic is used.
Properties
CLIP
Set this property to 1 to clip portions of the graphic that lie outside of the dataspace range, or to 0 to disable clipping. The default is 1. This property is ignored unless the DATA property is set.
HIDE
Set this property to 1 to hide the graphic. Set HIDE to 0 to show the graphic.
LABEL_COLOR
Set this property to a string or RGB vector that specifies the text color. The default value is 'black'.
LABEL_FILL_BACKGROUND
Set this property to 1 to fill the area inside the text box.
LABEL_FILL_COLOR
Set this property to a string or RGB vector that specifies the fill color inside the text box.
LABEL_FONT_NAME
Set this property to a string specifying the name of the IDL or system font to use for the text string. The default value is "DejaVuSans".
LABEL_FONT_SIZE
Set this property to an integer or floating-point value giving the font size in points. The default value is 9.
LABEL_FONT_STYLE
Set this property to an integer or string specifying the font style to be used for the text string. Allowed values are:
|
Integer |
String |
Resulting Style |
|
0 |
'Normal' or 'rm'
|
Default (Roman) |
|
1 |
'Bold' or 'bf' |
Bold |
|
2 |
'Italic' or 'it'
|
Italic |
|
3 |
'Bold italic' or 'bi'
|
Bold italic |
LABEL_ORIENTATION
Set this property to an integer specifying the angle in degrees to rotate the label text. The angle rotates counterclockwise from the positive x axis. The default value is 0 (no rotation).
LABEL_POSITION
Set this property to a string that specifies the location of the label string with respect to the symbol. Possible values are:
|
String |
Abbreviation |
|
'Center' |
'C' |
|
'Right' |
'R' |
|
'Bottom Right' |
'BR' |
|
'Top Right' |
'TR' |
|
'Top' |
'T' |
|
'Bottom' |
'B' |
|
'Left' |
'L' |
|
'Top Left' |
'TL' |
|
'Bottom Left' |
'BL' |
The default value is 'Right'.
LABEL_SHIFT
Set this property to a 2-element array specifying an amount to shift the location of the label in the X and Y directions. If the symbol is in the data space, these values should be specified using data coordinates. If the symbol is in the annotation layer, these values should be specified in normal coordinates.
LABEL_STRING
Set this property to a scalar string or an array of strings containing the label text. If there are less labels than symbols, then the labels are cyclically repeated. If LABEL_STRING is set to a scalar string, then all symbols will have the same label.
You can also add Greek letters and mathematical symbols using a TeX-like syntax. These symbols need to be enclosed within a pair of "$" characters. See Adding Mathematical Symbols and Greek Letters to the Text String for details on the available symbols.
LABEL_TRANSPARENCY
Set this property to an integer between 0 and 100 that specifies the percent transparency of the text. The default value is 0.
LINESTYLE
Set this property to an integer or string specifying the line style used to connect the symbols. The default is 'none'.
The following table lists the index values and strings you can use with this property.
|
Index |
Property |
Description |
|
0 |
'solid_line', '-'(dash)
|
solid line |
|
1 |
'dot', ':'(colon)
|
dotted |
|
2 |
'dash', '--' (double dashes)
|
dashed |
|
3 |
'dash_dot', '-.'
|
dash dot |
|
4 |
'dash_dot_dot_dot', '-:'
|
dash dot dot dot
|
|
5 |
'long_dash', '__' (two underscores)
|
long dash |
|
6 |
'none', ' ' (space)
|
no line |
You can also set the line style to a two-element vector, [repeat, bitmask], specifying a stippling pattern. The repeat indicates the number of times that individual bits in the bitmask should be repeated. (That is, if three consecutive 0’s appear in the bitmask and the value of repeat is 2, then the line that is drawn will have six consecutive bits turned off.) The value of repeat must be an integer between 1 and 255. The bitmask indicates which pixels are drawn and which are not along the length of the line. The bitmask should be specified as a 16-bit hexadecimal value. For example, [2, 'AAAA'X] describes a dashed line with very short dashes of length 2 bits each.
LINE_COLOR
Set this property to a string or RGB vector that specifies the color of the line connecting the symbols. Note that LINESTYLE must be set to a value other than 6 (no line) for the line to be visible.
Note: When plotting multiple symbols, if SYM_COLOR is set to an array of colors, then the lines connecting the symbols will correspond to the symbol colors and the LINE_COLOR property will be ignored.
LINE_THICK
Set this property to a value between 0 and 10 that specifies the line thickness for the line connecting the symbols. A thickness of 0 displays a thin hairline on the chosen device. The default value is 1. Note that LINESTYLE must be set to a value other than 6 (no line) for the line to be visible.
POSITION
Set this property to a two or four-element vector that determines the position of the graphic within the window. If two elements are provided, the center of the graphic will be translated to that position. For four elements, the coordinates [X1, Y1, X2, Y2] define the lower left and upper right corners of the graphic. Coordinates are expressed in normalized units ranging from 0.0 to 1.0. On creation, if the DEVICE keyword is set, the units are given in device units (pixels).
SYM_COLOR
Set this property to a string or RGB vector that specifies the color of the symbols or the symbol text. If you are drawing multiple symbols (X and Y are arrays) then SYM_COLOR can be set to either an N-element string array of color names, or to a 3 x N byte array where each row contains the 3-element RGB color for that symbol. If there are less colors than symbols, then the colors are cyclically repeated. If there is only a single color, then all symbols will have the same color.
Note: If SYM_TEXT is set then only the first color within SYM_COLOR will be used to color all of the symbol text.
SYM_FILLED
Set this property to fill the symbols.
Note: This property is ignored if SYM_TEXT is set.
SYM_FILL_COLOR
Set this property to a string or RGB vector that specifies the color of the filled portion of the symbol.
If this property is not set, the symbol fill color will match the SYM_COLOR.
Note: This property is ignored if SYM_TEXT is set.
SYM_FONT_FILL_BACKGROUND
Set this property to 1 to fill the area inside the text box when using a text string as the symbol.
Note: If SYMBOL is being displayed instead of SYM_TEXT, then this property is ignored.
SYM_FONT_FILL_COLOR
Set this property to a string or RGB vector that specifies the color inside the text box.
Note: If SYMBOL is being displayed instead of SYM_TEXT, then this property is ignored.
SYM_FONT_NAME
Set this property to a string specifying the name of the IDL or system font to use for the text symbol. The default value is "DejaVuSans".
Note: If SYMBOL is being displayed instead of SYM_TEXT, then this property is ignored.
SYM_FONT_SIZE
Set this property to an integer or floating-point value giving the font size in points. The default value is 11.
Note: If SYMBOL is being displayed instead of SYM_TEXT, then this property is ignored.
SYM_FONT_STYLE
An integer or string specifying the text symbol's font style. The valid values are:
|
Integer |
String |
Resulting Style |
|
0 |
"Normal" or "rm"
|
Default (Roman) |
|
1 |
"Bold" or "bf" |
Bold |
|
2 |
"Italic" or "it"
|
Italic |
|
3 |
"Bold italic" or "bi"
|
Bold italic |
Note: If SYMBOL is being displayed instead of SYM_TEXT, then this property is ignored.
SYM_ROTATE
Set this property to an integer specifying the angle in degrees to rotate the symbol text. The angle rotates counterclockwise from the positive x axis. The default value is 0 (no rotation).
Note: If SYMBOL is being displayed instead of SYM_TEXT, then this property is ignored.
SYM_SIZE
Set this property to a floating point value specifying the plot symbol size. The default value is 1.
Note: This property is ignored if SYM_TEXT is set.
SYM_TEXT
Set this property to a scalar string or an array of strings to be used as the symbol text. If there are fewer strings than symbol locations, the symbol text will be cyclically repeated. If SYM_TEXT is set to a scalar string, then all symbol locations will have the same symbol text. If this property is set the Symbol argument and the SYMBOL property are ignored. Set this property to an empty string to revert to using the SYMBOL property.
You can also add Greek letters and mathematical symbols using a TeX-like syntax. These symbols need to be enclosed within a pair of "$" characters. See Adding Mathematical Symbols and Greek Letters to the Text String for details on the available symbols.
SYM_THICK
Set this property to a floating point value between 0 and 10 that specifies the thickness (in points) of the lines used to draw the symbols. A value less than 1 displays as one pixel on the screen, but prints as a very thin line.
Note: This property is ignored if SYM_TEXT is set.
SYM_TRANSPARENCY
Set this property to an integer between 0 and 100 that specifies the percent transparency of the symbols or the symbol text. The default value is 0.
SYMBOL
Set this property to a string giving the symbol name. See Plot Symbol Values for a list of valid symbol strings. Use the Symbol argument when creating a graphic symbol. Use the SYMBOL property to modify a previously-created symbol.
Note: This property is ignored if SYM_TEXT is set.
UVALUE
Set this property to an IDL variable of any data type.
WINDOW (Get Only)
This property retrieves a reference to the WINDOW object which contains the graphic.
Additional Examples
Add a symbol to the data space of a plot
p = PLOT(/TEST)
s = SYMBOL(50, 0, '*', SYM_COLOR='Blue', SYM_SIZE=2, $
SYM_THICK=3, /DATA, LABEL_STRING='My star')
In this case, if you change the plot range by moving the plot with the mouse or using the XRANGE/YRANGE properties, the symbol will move with the plot.
Add a symbol to the annotation layer of a plot
p = PLOT(/TEST)
s = SYMBOL(0.5, 0.5, '*', SYM_COLOR='Blue', SYM_SIZE=2, $
SYM_THICK=3, /NORMAL, LABEL_STRING='My annotation')
In this case, changing the plot range does not affect the position of the symbol; it remains fixed in the window.
Add a character symbol to a map
m = MAP('orthographic', $
LIMIT=[35.86, -110.51, 42.58, -100.01], $
CENTER_LONGITUDE=-105, CENTER_LATITUDE=40)
c = MAPCONTINENTS(/USA)
m.MAPGRID.HIDE = 1
s1 = SYMBOL(-104.48, 39.58, SYM_TEXT='$\alpha$', $
SYM_COLOR='Green', LABEL_STRING='Primary Site', $
/DATA, LABEL_POSITION='Top', $
SYM_FONT_SIZE=20)
s2 = SYMBOL(-106.21, 39.38, SYM_TEXT='$\beta$', $
SYM_COLOR='Green', LABEL_STRING='Backup Site', $
/DATA, LABEL_POSITION='Bottom', $
SYM_FONT_SIZE=20)
See Adding Mathematical Symbols and Greek Letters to the Text String for details on the available symbols.
Add a Unicode character symbol to a plot
p = PLOT( FINDGEN(10), XSTYLE=1, YSTYLE=1)
s2 = SYMBOL( 0.3, 0.7, /NORMAL, SYM_TEXT='!Z(7546)', $
LABEL_STRING='Unicode Symbol', SYM_FONT_SIZE=20, $
SYM_FONT_NAME='Arial Unicode MS')
For an explanation of the !Z syntax for choosing a Unicode character, refer to Positioning Commands.
Note: The Arial Unicode MS font used in this example may not be available on your system, but the syntax for choosing a Unicode character is the same for all platforms.
Version History
|
8.1 |
Introduced |
|
8.2 |
Added the following properties: CLIP, LINESTYLE, LINE_COLOR, LINE_THICK, SYM_TEXT.
Added support for multiple symbols to the X and Y arguments, and to the LABEL_STRING, SYM_COLOR, and SYM_TEXT properties.
Added the GetData and SetData methods.
|
|
8.2.2 |
Added POSITION property.
|
|
8.2.3 |
Added the ability to use a stippling pattern for LINESTYLE.
|
| 8.5 |
Added HIDE property. |
| 8.6 |
Changed default font name and font size. |
See Also
!COLOR, Formatting IDL Graphics Symbols and Lines