The VOLUME function displays a visual representation of a three-dimensional array of data.
Example
The following lines create the volume shown above.
file = FILEPATH('head.dat', SUBDIRECTORY = ['examples', 'data'])
data = READ_BINARY(file, DATA_DIMS = [80, 100, 57])
vol = VOLUME(data)
Syntax
graphic = VOLUME(Vol0 [, Vol1] [, Vol2, Vol3] [, Keywords=value] [, Properties=value])
Keywords
Keywords are applied only during the initial creation of the graphic.
AXIS_STYLE=value
/BUFFER, /CURRENT, /DEVICE, DIMENSIONS=[width, height], DRAG_QUALITY=quality, LAYOUT=array, LOCATION=[x, y], MARGIN=scalar or [left, bottom, right, top], /NO_TOOLBAR, /NODATA, /OVERPLOT, /WIDGETS
VOLUME_DIMENSIONS=array
VOLUME_LOCATION=array
Properties
Properties can be set as keywords to the function during creation, or retrieved or changed using the "." notation after creation.
AMBIENT, ASPECT_RATIO, ASPECT_Z, AUTO_RENDER, AXES, BACKGROUND_COLOR, BACKGROUND_TRANSPARENCY, BOUNDS, CLIP, CLIP_PLANES, COLOR, COMPOSITE_FUNCTION, DEPTH_CUE, EXTENTS_TRANSPARENCY, EYE, FONT_COLOR, FONT_NAME, FONT_SIZE, FONT_STYLE, HIDE, HINTS, INTERPOLATE, LIGHTING_MODEL, MAX_VALUE, MIN_VALUE, NAME, OPACITY_TABLE0, OPACITY_TABLE1, PERSPECTIVE,POSITION, RENDER_EXENTS, RENDER_QUALITY, RENDER_STEP, RGB_TABLE0, RGB_TABLE1, TITLE, TWO_SIDED, UVALUE, WINDOW, WINDOW_TITLE, XRANGE, YRANGE, ZBUFFER, ZERO_OPACITY_SKIP, ZCLIP, ZRANGE
Methods
Close
ConvertCoord
CopyWindow
Delete
Erase
GenerateCode
GetData
GetValueAtLocation
MapForward
MapInverse
Order
Print
Refresh
Rotate
Save
Scale
Select
SetData
Translate
Note: The GetValueAtLocation method is not supported for VOLUME.
Return Value
The Volume function returns a reference to the created graphic. Use the returned reference to manipulate the graphic after creation by changing properties or calling methods.
Arguments
Vol0, Vol1, Vol2, Vol3
A three-dimensional array of any numeric type containing volume data. Arrays of strings, structures, object references, and pointers are not allowed. If more than one volume is specified, they must all have the same dimensions.
The number of volumes present and the value of the COMPOSITE_FUNCTION property determine how the volume data is rendered by the iVolume tool. The number of volume arguments determine how the src and srcalpha values for the COMPOSITE_FUNCTION are computed:
- If Vol0 is the only argument present, the values of src and srcalpha are taken directly from the RGB and OPACITY tables, as indexed by each volume data sample:
src = RGB_TABLE0[VOL0]
srcalpha = OPACITY_TABLE0[VOL0]
- If Vol0 and Vol1 are the only arguments present, the two volumes are blended together using independent tables:
src = (RGB_TABLE0[VOL0]*RGB_TABLE1[VOL1])/256
srcalpha = (OPACITY_TABLE0[VOL0]*OPACITY_TABLE1[VOL1])/256
- If all the arguments are present, Vol0 indexes the red channel of RGB_TABLE0, Vol1 indexes the green channel of RGB_TABLE0, and Vol2 indexes the blue channel of RGB_TABLE0. The Vol3 argument indexes OPACITY_TABLE0:
src = (RGB_TABLE[VOL0, 0], RGB_TABLE[VOL1, 1], $
RGB_TABLE[VOL2, 2])/256
srcalpha = (OPACITY_TABLE0[VOL3])/256.
If all the arguments are present, the composite function cannot be set to the average-intensity projection (COMPOSITE_FUNCTION = 3) test for conditional text.
Note: The volume data provided in the Vol0, Vol1, Vol2, and Vol3 arguments are scaled into byte values (ranging from 0 to 255) with the BYTSCL function to facilitate using the volume data as indices into the RGB and OPACITY tables. This scaling is done for display purposes only. By default, the function uses the minimum and maximum values of all volume parameters to uniformly byte-scale the data.
Keywords
AXIS_STYLE
Set this keyword to one of the following values:
- 0 - No axes. Decrease the margins so the graphic almost fills the window. This is the default for images.
- 1 - Single X, Y (and Z if 3D) axes located at the minimum data value. The margins will be adjusted to leave space for the axes. This is the default for 3D graphics.
- 2 - Box axes - multiple axes located at both the minimum and maximum data values. The margins will be adjusted to leave space for the axes. This is the default for 2D graphics.
- 3 - Crosshair-style axes - located at the midpoint of each data dimension. Since the axes are in the middle, decrease the margins so the graphic almost fills the window. This is the default for polar plots.
- 4 - No axes, but use the same margins as if axes were there. This is useful if you want to later add another graphic that does have axes, and you want the two visualizations to be aligned properly.
You can set the following properties on the axes:
|
Property |
Description |
|
[XYZ]COLOR |
A string or RGB vector containing the axis color.
|
|
[XYZ]GRIDSTYLE |
A string, integer, or 2-element vector giving the linestyle for tickmarks.
|
|
[XYZ]LOG |
Set to 1 if the axis is logarithmic. The minimum value of the axis range must be greater than zero.
|
|
[XYZ]MAJOR |
The number of major tick marks. Set to -1 to auto-compute, set to 0 to suppress.
|
|
[XYZ]MINOR |
The number of minor tick marks. Set to -1 to auto-compute, set to 0 to suppress.
|
|
[XYZ]SUBGRIDSTYLE
|
A string, integer, or 2-element vector giving the linestyle for the minor tickmarks. The default is 0, for solid lines. Set to -1 to force minor ticks to have the same linestyle as major ticks.
|
|
[XYZ]SHOWTEXT |
Set to 1 to show text labels or 0 to hide the text labels.
|
|
[XYZ]STYLE |
The axis range style. The valid values are:
(0) Nice range. Default for all graphics except Image, Barplot, and Map.
(1) Force the exact data range. Default for Image, Barplot, and Map.
(2) Pad the axes slightly beyond the nice range.
(3) Pad the axes slightly beyond the exact data range.
The [XYZ]RANGE takes precedence over this property.
|
|
[XYZ]SUBTICKLEN |
The ratio of the minor tick length to the major tick length. The default is 0.5.
|
|
[XYZ]TEXT_COLOR |
A string or RGB vector containing the axis text color.
|
|
[XYZ]TEXT_ORIENTATION
|
The angle (in degrees) of the tick mark labels.
|
|
[XYZ]TEXTPOS |
Set to 1 to position text above the axis. The default is 0, below the axis.
|
|
[XYZ]THICK |
Set to a floating-point value between 0 and 10 to specify the line thickness for tickmarks. A thickness of 0 gives a thin hairline. The default is 1.
|
|
[XYZ]TICKDIR |
Set to 1 to draw the tickmarks facing outwards. The default is 0, facing inwards.
|
|
[XYZ]TICKFONT_NAME
|
A string containing the font name for the axis text.
|
|
[XYZ]TICKFONT_SIZE
|
The axis text size in points.
|
|
[XYZ]TICKFONT_STYLE
|
A string or integer containing the font style: normal (0), bold (1), italic (2), or bold italic (3).
|
|
[XYZ]TICKFORMAT |
A string or string array of tick label formats. See Format Codes for more information.
|
|
[XYZ]TICKINTERVAL
|
The interval between major tick marks.
|
|
[XYZ]TICKLAYOUT |
Set to 1 to suppress tick marks; set to 2 to draw a box around the tick labels.
|
|
[XYZ]TICKLEN |
The length of each major tick mark, normalized to the width or height of the graphic. The default value is automatically calculated based upon the aspect ratio of the graphic.
|
|
[XYZ]TICKNAME |
A string array containing the tick labels.
|
|
[XYZ]TICKUNITS |
A string giving the tick units. Valid values are: null (the default, signified by empty quotes), Years, Months, Days, Hours, Minutes, Seconds, Time, exponent for exponential notation, or scientific for scientific notation.
If any of the time units are utilized, then the tick values are interpreted as Julian date/time values. If more than one unit is provided, the axis will be drawn with multiple levels.
|
|
[XYZ]TICKVALUES |
An array of tick mark locations.
|
|
[XYZ]TITLE |
A string giving the axis title.
|
|
[XYZ]TRANSPARENCY
|
An integer from 0-100 giving the percent transparency.
|
For more detailed explanations of these properties, see the AXIS function.
Tip: You can also use the AXIS function to insert additional axes after the graphic has been created.
BUFFER
Set this keyword to 1 to direct the graphics to an off-screen buffer instead of creating a window.
CURRENT
Set this keyword to create the graphic in the current window with a new set of axes. If no window exists, a new window is created. The WINDOW's SetCurrent method may be used to set the current window.
Or, set this keyword to an existing IDL Graphic reference to make that window be the current window and direct the new graphic to that window.
Tip: The CURRENT keyword is usually used with the LAYOUT keyword or POSITION property to produce a window which has multiple graphics in different locations.
Tip: For the graphic share the same axes as an existing graphic, use the OVERPLOT keyword instead.
DEVICE
Set this keyword if values are specified in device coordinates (pixels) for the MARGIN and POSITION keywords. (Normalized coordinates are the default for these keywords.)
DIMENSIONS
Set this keyword to a two-element vector of the form [width, height] to specify the window dimensions in pixels. If you do not specify a value for DIMENSIONS, IDL by default uses the values of the IDL_GR_WIN_HEIGHT and IDL_GR_WIN_WIDTH preferences for Windows platforms or the IDL_GR_X_HEIGHT and IDL_GR_X_WIDTH preferences for X Windows systems on UNIX.
Tip: The minimum width is set by the toolbar in the window, usually around 400 pixels. To create a smaller graphics window, use the NO_TOOLBAR keyword.
DRAG_QUALITY
Set this keyword to 0, 1, or 2 to control the rendering quality and performance during moves, transformations, and rotations initiated with the mouse. The default value is 2, which maintains full rendering quality during mouse interactions. Set to 1 to reduce the drawing quality, or to 0 to further reduce or in some cases disable drawing during dragging or resizing.
LAYOUT
Set this keyword to a three-element vector [ncol, nrow, index] that arranges graphics in a grid. The first dimension ncol is the number of columns in the grid, nrow is the number of rows, and index is the grid position at which to place the graphic (starting at element 1). This keyword is ignored if either OVERPLOT or POSITION is specified.
LOCATION
Set this keyword to a two-element vector [X offset, Y offset] giving the window's screen offset in pixels.
MARGIN
Set this keyword to the current graphic’s margin values in the layout specified by the LAYOUT property. Use a scalar value to set the same margin on all sides, or use a four-element vector [left, bottom, right, top] to specify different margins on each side.
By default, margin values are expressed in normalized units ranging from 0.0 to 0.5. If the DEVICE keyword is set, the values are given in device units (pixels).
This keyword is ignored if either OVERPLOT or POSITION is specified.
NO_TOOLBAR
By default the graphics window will have a toolbar containing some common tools such as Print and Save. Set this keyword to remove the toolbar. This keyword has no effect if the window is already created.
Tip: When the toolbar exists, the minimum window width is set to the toolbar's width, usually around 400 pixels. To create a smaller graphics window, use the NO_TOOLBAR keyword.
NODATA
Set this keyword to 1 to create the graphic, but without any data attached to it. The axes and title (if present) are also created and displayed. If the OVERPLOT keyword is specified, axis ranges will not change.
Note: You must still provide valid input arguments. The data range of the input arguments are used to automatically set the range of the axes. The [XYZ]RANGE properties may be used to override these default ranges.
OVERPLOT
Set this keyword to 1 (one) to place the graphic on top of the currently-selected graphic within the current window. The two graphics items will then share the same set of axes. If no current window exists, then this keyword is ignored and a new window is created.
If you have a graphic in another window that is not currently selected, you can also set this keyword to that graphic's reference to overplot on top of that graphic.
Tip: For the graphic to have a new set of axes, use the CURRENT keyword instead.
WIDGETS
By default, when running from the IDL Workbench, the graphics window will use the native widgets for your platform. Set this keyword to instead use IDL widgets for the graphics window. This keyword is ignored when running from the IDL command line, since IDL widgets are always used in that case.
VOLUME_DIMENSIONS
A 3-element vector specifying the volume dimensions in terms of user data units. For example, specifying [0.1, 0.1, 0.1] would cause IDL to render the volume into a region that is 0.1 data units long on each side of the volume cube. If you do not specify this parameter, IDL renders the volume into a region the same size as the number of samples with an origin of [0, 0, 0]. In this case, a volume with sample size of [20, 25, 20] would render into the region [0:19, 0:24, 0:19] in user data units. Use the VOLUME_LOCATION keyword to specify a different origin.
VOLUME_LOCATION
A 3-element vector specifying the volume location in user data units. Use this keyword to render the volume so that the first sample voxel appears at the specified location, instead of at [0, 0, 0], the default. Specify the location in terms of coordinates after the application of the VOLUME_DIMENSIONS values. For example, if the value of the VOLUME_DIMENSIONS keyword is [0.1, 0.1, 0.1] and you want the volume to be centered at the origin, set the VOLUME_LOCATION keyword to [-0.05, -0.05, -0.05].
Properties
AMBIENT
Use this property to set the color and intensity of the volume’s base ambient lighting. Color is specified as an RGB vector. The default is [255, 255, 255]. AMBIENT is applicable only when you also set LIGHTING_MODEL.
ASPECT_RATIO
A floating point value indicating the ratio of the Y-dimension to the X-dimension in data units. If this property is set to a nonzero value, IDL preserves the aspect ratio as the graphic is stretched or shrunk. The default value is 0 for all graphics except images, meaning that the aspect ratio is not fixed but is allowed to change as the graphic is stretched or shrunk.
ASPECT_Z
For 3-D graphics, a floating point value indicating the ratio of the Z-dimension to the X- and Y-dimensions, in data units. If this is a nonzero value, IDL preserves the aspect ratio as the visualization is stretched or shrunk. The default value is 0, meaning that the aspect ratio is not fixed but is allowed to change as the visualization is stretched or shrunk.
AUTO_RENDER
Set this property to always render the volume each time the tool window is drawn (the default behavior). Explicitly set this keyword to zero to disable automatic rendering.
AXES (Get Only)
This property retrieves an array that contains all of the AXIS objects within the visualization. For example, for a plot visualization:
p = PLOT(/TEST)
ax = p.AXES
ax[0].TITLE = 'X axis'
ax[1].TITLE = 'Y axis'
ax[2].HIDE = 1
ax[3].HIDE = 1
See AXIS for a list of the available properties.
BACKGROUND_COLOR
Set this property to a string or RGB vector indicating the graphic's background color. The default value is [255, 255, 255] (white). Set this property to a scalar value to remove the background color.
Tip: To set the background color of the entire window, retrieve the window object using the WINDOW property and set the BACKGROUND_COLOR on the window object.
BACKGROUND_TRANSPARENCY
Set this property to an integer between 0 and 100 giving the percent transparency of the background color. The default is 100 (completely transparent).
Note: If the BACKGROUND_COLOR property is changed and the current background transparency is 100, then the BACKGROUND_TRANSPARENCY will be automatically set to 0 (opaque) so that you can see the new color.
BOUNDS
Set this property to a six-element vector of the form [xmin, ymin, zmin, xmax, ymax, zmax], which represents the sub-volume you wish to render.
CLIP
Set this property to 1 to clip portions of the graphic that lie outside of the dataspace range, or to 0 to disable clipping. The default is 1.
CLIP_PLANES
Set this property to an array of dimensions [4, N] specifying the coefficients of the clipping planes you wish to apply to this object. The four coefficients for each clipping plane are of the form [A, B, C, D], where Ax + By + Cz + D = 0. Portions of this object that fall in the half space Ax + By + Cz + D > 0 will be clipped. By default, the value of this keyword is a scalar (-1) indicating that DIL should not apply clipping planes.
Note: Clipping planes are equivalent to the obsolete cutting planes. If defined, CUTTING_PLANES will be applied first, then the CLIP_PLANES (until a maximum number of planes is reached).
Note: A window is only able to support a limited number of clipping planes. Some of these clipping planes may already be in use by the tool to support specific data display features. If the total number of clipping planes exceeds the limit, an informational message is displayed.
COLOR
Set this property to a string or RGB vector indicating the color of the background walls when RENDER_EXTENTS=2, or the wire-frame when RENDER_EXTENTS=1.
COMPOSITE_FUNCTION
The composite function determines the value of a pixel on the viewing plane by analyzing the voxels falling along the corresponding ray, according to one of the following compositing functions:
0 = Alpha (default): Alpha-blending. The recursive equation
dest' = src * srcalpha + dest * (1 - srcalpha)
is used to compute the final pixel color.
1 = MIP: Maximum intensity projection. The value of each pixel on the viewing plane is set to the brightest voxel, as determined by its opacity. The most opaque voxel’s color appropriation is then reflected by the pixel on the viewing plane.
2 = Alpha sum: Alpha-blending. The recursive equation
dest' = src + dest * (1 - srcalpha)
is used to compute the final pixel color. This equation assumes that the color tables have been pre-multiplied by the opacity tables. The accumulated values can be no greater than 255.
3 = Average: Average-intensity projection. The resulting image is the average of all voxels along the corresponding ray.
This option (COMPOSITE_FUNCTION = 3) is not supported for 4-channel volumes.
The COMPOSITE_FUNCTION setting is used only when RENDER_QUALITY is set to 2 (High).
DEPTH_CUE
Set this property to a two-element floating-point array [zbright, zdim] specifying the near and far Z-planes between which depth cueing is in effect.
Depth cueing causes an object to appear to fade into the background color of the view object with changes in depth. If the depth of an object is further than Zdim (that is, if the object’s location in the Z-direction is farther from the origin than the value specified by Zdim), the object will be painted in the background color.
Similarly, if the object is closer than the value of Zbright, the object will appear in its “normal” color. Anywhere in-between, the object will be a blend of the background color and the object color. For example, if the DEPTH_CUE property is set to [0, 1], an object at the depth of 0.0 will appear as a 50% blend of the object color and the view color.
The relationship between Zbright and Zdim determines the result of the rendering:
- Zbright < Zdim: Rendering darkens with depth
- Zbright > Zdim: Rendering brightens with depth
- Zbright = Zdim: Disables depth cueing
You can disable depth cueing by setting Zbright = Zdim. The default is [0.0, 0.0].
EXTENTS_TRANSPARENCY
Set this property to an integer that specifies the percent transparency of the volume’s boundary wire-frame or walls.
EYE
A floating-point value that specifies the distance from the eyepoint to the viewplane (Z=0). The default is 4.0. The eyepoint is always centered within the viewplane rectangle. IDL converts, maintains, and returns this data as a double-precision floating-point.
FONT_COLOR
Set this property to a string or RGB vector that specifies the text color of the title and axes (if present). The default value is "black".
FONT_NAME
Set this property equal to a string specifying the IDL or system font for the title and axes (if present). The default value is "DejaVuSans".
FONT_SIZE
Set this property equal to an integer specifying the font size for the title and axes (if present). The default value is 9 points for the axis text and 11 points for the title.
FONT_STYLE
Set this property equal to an integer or a string specifying the font style for the title and axes (if present). Allowed values are:
|
Integer |
String |
Resulting Style |
|
0 |
"Normal" or "rm"
|
Default (roman) |
|
1 |
"Bold" or "bf" |
Bold |
|
2 |
"Italic" or "it"
|
Italic |
|
3 |
"Bold italic" or "bi"
|
Bold italic |
HIDE
Set this property to 1 to hide the graphic. Set HIDE to 0 to show the graphic.
HINTS
Set this property to specify one of the following acceleration hints:
0 = Disables all acceleration hints (default).
1 = Enables Euclidean distance map (EDM) acceleration. This option generates a volume map containing the distance from any voxel to the nearest non-zero opacity voxel. This volume map allows the ray to jump over open spaces which is used to speed ray casting. It is most useful with sparse volumes. After setting the EDM hint, the draw operation generates the volume map; this process can take some time. Subsequent draw operations will reuse the generated map and may be much faster, depending on the volume’s sparseness. IDL does not automatically generate a new map to match changes in opacity tables or volume data (for performance reasons). The user may force recomputation of the EDM map by setting the HINTS property to 1 again.
2 = Enables the use of multiple CPUs for volume rendering if the platforms used support such use. If HINTS is set to 2, IDL will use all the available (up to 8) CPUs to render portions of the volume in parallel.
3 = Selects the acceleration options of both option 1 and option 2.
INTERPOLATE
Set this property to indicate that trilinear interpolation (see INTERPOLATE function) is to be used to determine the data value for each step on a ray. Setting this keyword improves the quality of images produced, at the cost of more computing time, especially when the volume has low resolution with respect to the size of the viewing plane.
IDL uses nearest neighbor sampling by default.
LIGHTING_MODEL
Set this property to use the current lighting model during rendering in conjunction with a local gradient evaluation.
Note: The volume object only honors a DIRECTIONAL light source. Because normals must be computed for all voxels in a lighted view, enabling light sources increases the rendering time.
MAX_VALUE
The maximum value to be plotted. If this property is set, IDL treats data values greater than the value of MAX_VALUE as missing data and does not plot them.
Note: The IEEE floating point value NaN is also treated as missing data.
MIN_VALUE
The minimum value to be plotted. If this property is set, IDL treats data values less than the value of MIN_VALUE as missing data and does not plot them.
Note: The IEEE floating point value NaN is also treated as missing data.
NAME
A string that specifies the name of the graphic. Use the name to retrieve the graphic using the brackets array notation. If you do not specify NAME, IDL sets the property based on the graphic type.
OPACITY_TABLE0
Set this property to a 256-element byte array to specify an opacity table for Vol0 if Vol0 or Vol0 and Vol1 are present. If all the volume arguments are present, this keyword represents the opacity of the resulting RGBA volume. A value of 0 indicates complete transparency and a value of 255 indicates complete opacity. The default table is a linear ramp.
OPACITY_TABLE1
Set this property to a 256-element byte array to specify an opacity table for Vol1 when Vol0 and Vol1 are present. A value of 0 indicates complete transparency and a value of 255 indicates complete opacity. The default table is a linear ramp.
PERSPECTIVE
Set this property to 1 to enable a perspective graphics projection. In the perspective projection, objects that are further away will appear smaller. The default is 0, which is the orthogonal perspective.
POSITION
Set this property to a four-element vector that determines the position of the graphic within the window on the XY plane. The coordinates [X1, Y1, X2, Y2] define the lower left and upper right corners of the graphic. Coordinates are expressed in normalized units ranging from 0.0 to 1.0. On creation, if the DEVICE keyword is set, the units are given in device units (pixels).
Note: After creation, you can set the POSITION to either a two or four-element vector. If you provide two elements, IDL translates the center of the graphic to that position. If you provide four elements, IDL translates and scales the graphic to fit the position.
RENDER_EXTENTS
Set this property to draw a boundary around the rendered volume. The default (RENDER_EXTENTS = 2) is to draw a translucent boundary box. Possible values for this keyword are:
0 = Do not draw anything around the volume.
1 = Draw a wire-frame around the volume.
2 = Draw a translucent box around the volume
RENDER_QUALITY
Set this property to determine the quality of the rendered volume. The default (RENDER_QUALITY = 1) is low quality. Possible values for this keyword are:
1 = Low - Renders volume with a stack of two-dimensional texture maps.
2 = High - Use ray-casting rendering, see the COMPOSITE_FUNCTION for more details.
RENDER_STEP
Set this keyword to a three element vector of the form [x, y, z] to specify the stepping factor through the voxel matrix. This keyword is only valid if render quality is set to high (RENDER_QUALITY = 2). The default render step is [1, 1, 1].
RGB_TABLE0
Set this property to the number of the predefined IDL color table, or to either a 3-by-256 or 256-by-3 byte array of RGB color values to specify a color table for Vol0 if Vol0 or Vol0 and Vol1 are present. If all the arguments are present, this keyword represents the RGB color values of all of these volumes. The default is a linear ramp.
RGB_TABLE1
Set this property to the number of the predefined IDL color table, or to either a 3-by-256 or 256-by-3 byte array of RGB color values to specify a color table for Vol1 when Vol0 and Vol1 are present. The default is a linear ramp.
TITLE
Set this property to a string specifying a title. You can modify the title property using FONT_COLOR, FONT_NAME, FONT_SIZE, and FONT_STYLE. After creation, use the TITLE property to retrieve a reference to the title text object, and the TEXT properties to modify the title object.
You can add Greek letters and mathematical symbols using a TeX-like syntax, enclosed within a pair of "$" characters. See Adding Mathematical Symbols and Greek Letters to the Text String for details.
TWO_SIDED
Set this property to force the lighting model to use a two-sided voxel gradient. For a two-sided gradient, the absolute value of the inner product of the light direction and the surface gradient is used instead of clamping to 0.0 for negative values.
UVALUE
Set this property to an IDL variable of any data type.
WINDOW (Get Only)
This property retrieves a reference to the WINDOW object which contains the graphic.
WINDOW_TITLE
Set this property to the title of the IDL Graphic window. The title is displayed in the window's title bar.
XRANGE
A two-element vector giving the X data range to plot. The default behavior is to plot the entire data range.
YRANGE
A two-element vector giving the Y data range to plot. The default behavior is to plot the entire data range.
ZBUFFER
Set this property to clip the rendering to the current Z-buffer and then update the buffer.
ZCLIP
Set this property to a two-element floating-point vector representing the near and far clipping planes. The vector should take the form [near, far]. By default, these values are [1, -1]. IDL converts, maintains, and returns this data as a double-precision floating-point.
ZERO_OPACITY_SKIP
Set this property to skip voxels with an opacity of 0. This keyword can increase the output contrast of MIP (MAXIMUM_INTENSITY) projections by allowing the background to show through. If you set this keyword, voxels with an opacity of zero will not modify the Z-buffer. The default (not setting the keyword) continues to render voxels with an opacity of zero.
ZRANGE
A two-element vector giving the Z data range to plot. The default behavior is to plot the entire data range.
Additional Examples
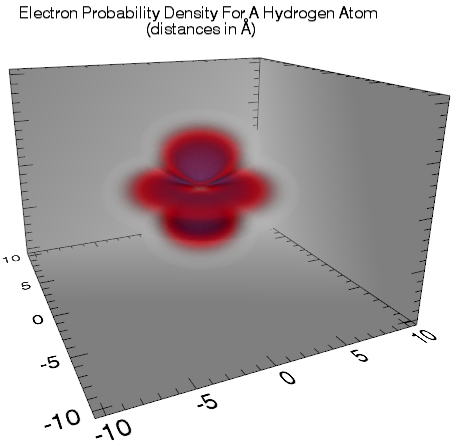
The following lines create the volume shown above.
n = 141L
a = 40 * FINDGEN(n) / (n - 1) - 20
x = REBIN(a, n, n, n)
y = REBIN(REFORM(a, 1, n), n, n, n)
z = REBIN(REFORM(a, 1, 1, n), n, n, n)
spherCoord = CV_COORD( $
FROM_RECT = TRANSPOSE([[x[*]], [y[*]], [z[*]]]), /TO_SPHERE)
phi = REFORM(spherCoord[0, *], n, n, n)
theta = REFORM(!PI / 2 - spherCoord[1, *], n, n, n)
r = REFORM(spherCoord[2, *], n, n, n)
L = 2
M = 0
angularState = SPHER_HARM(theta, phi, L, M, /DOUBLE)
radialFunction = EXP(-r / 2) * (r^2)
waveFunction = angularState * radialFunction
probabilityDensity = ABS(waveFunction)^2
v = VOLUME(probabilityDensity, RENDER_EXTENTS=0, $
HINTS = 3, /AUTO_RENDER, $
RGB_TABLE0=15, AXIS_STYLE=2, $
RENDER_QUALITY=2, BACKGROUND_COLOR='gray', $
DEPTH_CUE=[0, 2], /PERSPECTIVE, $
VOLUME_LOCATION=[-20, -20, -20] * 0.528, $
VOLUME_DIMENSIONS=[40.0, 40.0, 40.0] * 0.528)
t = TEXT(0.5, 0.8, ALIGNMENT=0.5, 'Electron Probability ' + $
'Density For A Hydrogen Atom !C(distances in $\AA$)')
ax = v.AXES
ax[2].HIDE = 1
ax[7].HIDE = 1
ax[6].HIDE = 1
v.Rotate, -5, /ZAXIS
v.Rotate, -10, /XAXIS
v.Rotate, 5, /YAXIS
Version History
|
8.2.3 |
Introduced |
| 8.6 |
Changed default font name and font size. |
See Also
!COLOR, AXIS, Axes in Graphics, Graphics, Graphics Methods, IDL Graphics Gallery