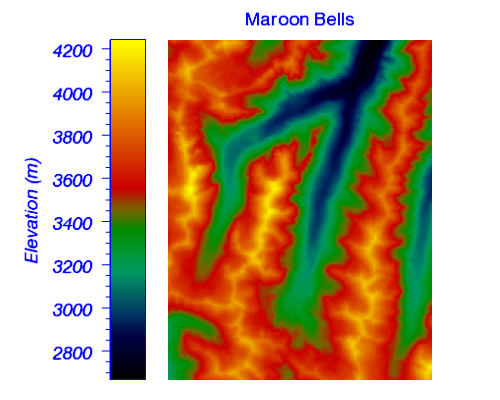
With the COLORBAR function, you can add a colorbar annotation to an existing IDL Graphic, or create a colorbar from scratch.
Example
file = FILEPATH('surface.dat', $
SUBDIR=['examples','data'])
data = READ_BINARY(file, DATA_DIMS=[350,450], $
DATA_TYPE=2, ENDIAN='little')
im = IMAGE(data, RGB_TABLE=4, $
POSITION=[0.25,0.05,0.95,0.9], $
FONT_COLOR='Blue', FONT_SIZE=16, $
TITLE='Maroon Bells')
c = COLORBAR(TARGET=im, ORIENTATION=1, $
POSITION=[0.22,0.05,0.29,0.9], $
TITLE='Elevation (m)')
c.TEXTPOS = 0
c.TICKDIR = 1
c.BORDER_ON = 1
c.COLOR = 'Blue'
c.FONT_STYLE = 'Italic'
c.FONT_SIZE = 16
Syntax
graphic = COLORBAR([, /DATA] [, /DEVICE] [, /NORMAL] [, /RELATIVE] [, TARGET=variable] [, Properties=value])
Properties
Properties can be set as keywords to the function during creation, or retrieved or changed using the "." notation after creation.
ANTIALIAS, BORDER, CLIP, COLOR, FONT_NAME, FONT_SIZE, FONT_STYLE, HIDE, MAJOR, MINOR, NAME, ORIENTATION, POSITION, RANGE, RGB_TABLE, SUBTICKLEN, TAPER, TEXT_COLOR, TEXT_ORIENTATION, TEXTPOS, THICK, TICKDIR, TICKFORMAT, TICKINTERVAL, TICKLAYOUT, TICKLEN, TICKNAME, TICKVALUES, TITLE, TRANSPARENCY, UVALUE, WINDOW
Methods
Close
ConvertCoord
CopyWindow
Delete
Erase
Order
Print
Refresh
Rotate
Save
Scale
Select
Translate
Return Value
The COLORBAR function returns a reference to the created graphic. Use the returned reference to manipulate the graphic after creation by changing properties or calling methods.
Arguments
None.
Keywords
Keywords are applied only during the initial creation of the graphic.
DATA
Set this keyword if the POSITION units are in data coordinates.
DEVICE
Set this keyword if the POSITION units are in device coordinates.
NORMAL
Set this keyword if the POSITION units are in normal coordinates (the default).
RELATIVE
Set this keyword to indicate that the input arguments are specified in normalized [0,1] coordinates, relative to the axis range of the TARGET's dataspace. If the TARGET keyword is not specified, then setting /RELATIVE is the same as setting /NORMAL.
Note: When using /RELATIVE, even though the coordinates are relative to the TARGET's dataspace, the graphic is added to the annotation layer, not to the dataspace.
TARGET
Set this keyword to the visualization to which the colorbar should be associated. If TARGET is not specified, and the RGB_TABLE property is not set, then any currently selected objects will be used. If the target does not have a color palette, then no colorbar will be created.
Properties
ANTIALIAS
By default anti-aliasing is used when drawing lines. Set this property to 0 to disable anti-aliasing.
BORDER
Set this property to display a border around the image portion of the colorbar.
CLIP
Set this property to 1 to clip portions of the graphic that lie outside of the dataspace range, or to 0 to disable clipping. The default is 1. This property is ignored unless the DATA property is set.
COLOR
Set this property to a string or RGB vector giving the color of the border and tickmarks of the colorbar. The default is "black".
FONT_NAME
Set this property equal to a string specifying the IDL or system font for the text. The default value is "DejaVuSans".
FONT_SIZE
Set this property equal to an integer specifying the font size for the text. The default value is 8 points.
FONT_STYLE
Set this property equal to an integer or a string specifying the font style for the text. Allowed values are:
|
Integer |
String |
Resulting Style |
|
0 |
"Normal" or "rm"
|
Default (roman) |
|
1 |
"Bold" or "bf" |
Bold |
|
2 |
"Italic" or "it"
|
Italic |
|
3 |
"Bold italic" or "bi"
|
Bold italic |
HIDE
Set this property to 1 to hide the graphic. Set HIDE to 0 to show the graphic.
MAJOR
Set this property to an integer representing the number of major tick marks. The default value is -1, specifying that IDL will compute the number of tickmarks. Setting MAJOR equal to 0 suppresses major tickmarks entirely.
MINOR
Set this property to an integer representing the number of minor tick marks. The default value is -1, specifying that IDL will compute the number of tickmarks. Setting MINOR equal to 0 suppresses minor tickmarks entirely.
NAME
Set this property to a string that specifies the name of the graphic. The name can be used to retrieve the graphic using the brackets array notation. If NAME is not set then a default name is chosen based on the graphic type.
ORIENTATION
Set this property to specify whether the colorbar is displayed horizontally (ORIENTATION=0, the default), or vertically (ORIENTATION=1). Note: Changing the orientation of a colorbar will reset any scaling or rotation that has occurred.
POSITION
Set this property to set the location of the colorbar. POSITION is specified as a four-element vector:[X1, Y1, X2, Y2], defining the lower left and upper right corners of the image portion of the colorbar. By default the colorbar is centered either underneath (ORIENTATION=0) or on the right side (ORIENTATION=1) of the image.
RANGE
Set this property to a two-element vector giving the data range of the colorbar. This property is only used when you are creating a custom colorbar, and is ignored if you specify a TARGET.
RGB_TABLE
Set this property to one of the following values:
This property is only used when you are creating a custom colorbar, and is ignored if you specify a TARGET. See below for the difference between continuous and discrete colorbars.
SUBTICKLEN
Set this property to a floating point scale ratio specifying the length of minor tick marks relative to the length of major tick marks. The default value is 0.5, specifying that the minor tick mark is one-half the length of the major tick mark.
TAPER
Set this property to create tapered ends on the colorbar. Possible values are:
Note: By default, for a colorbar associated with a line contour plot, the colorbar has no tapered ends (TAPER=0). For a colorbar associated with a filled contour plot, the colorbar may have tapered ends. If the lowest contour level is equal to or lower than the lowest contour data value, then the left end will be tapered (TAPER=2). If the highest contour level is equal to or greater than the highest contour data value, then the right end will be tapered (TAPER=3). If both conditions are true then both ends will be tapered (TAPER=1). If neither condition is true then the ends will not be tapered (TAPER=0). See the example below.
TEXT_COLOR
Set this property to a string or RGB vector containing the axis text color. The default value is the same color as the COLOR property.
TEXT_ORIENTATION
Set this property to the angle (in degrees) of the tick mark labels. The default is 0.
TEXTPOS
Set this property to 1 to position the tick labels and axis title above the axis. The default is 0, below the axis.
Tip: The TICKDIR property may be used to control the direction of axis tick marks.
THICK
Set this property to a value between 0 and 10 that specifies the line thickness. A thickness of 0 displays a thin hairline on the chosen device. The default value is 1.
TICKDIR
Set this property to 1 to draw the tickmarks facing outwards. The default is 0, facing inwards.
Tip: The TEXTPOS property may be used to control the position of tick mark data values and axis titles.
TICKFORMAT
Set this property to a string which represents a format string or the name of a function to be used to format the tick mark labels. TICKFORMAT can also be set to an array of format strings for each tick mark. If an array is provided, each string corresponds to a level of the axis. See AXIS for a detailed description of this property.
TICKINTERVAL
Set this property to a floating-point number indicating the interval between major tick marks. The default value is computed according to the axis range and the number of major tick marks (MAJOR). If this property is set then the MAJOR property is ignored.
TICKLAYOUT
Set this property to an integer that indicates the tick layout style. Set this property to 0 (the default) to draw the axis line, tick marks, and tick labels. Set to 1 to only draw the labels. Set to 2 to draw a box around the tick labels.
TICKLEN
Set this property to set the length of the tickmarks. The default is 0.25.
TICKNAME
Set this property to a string array containing the tick mark labels.
Note: To create a "discrete" colorbar, you should set TICKNAME equal to (or one more than) the number of colors in the RGB_TABLE. In this case, if you then want to only label certain tick marks, you should set the rest of the TICKNAME values equal to null strings. See below for the difference between continuous and discrete colorbars.
TICKVALUES
Set this property to an array of tick mark locations. If TICKVALUES is set to 0 (the default value), IDL computes the tick values based on the axis range and the number of major ticks.
TITLE
Set this property to a string representing the title of the axis.
You can add Greek letters and mathematical symbols using a TeX-like syntax, enclosed within a pair of "$" characters. See Adding Mathematical Symbols and Greek Letters to the Text String for details.
TRANSPARENCY
Set this property to an integer between 0 and 100 that specifies the percent transparency of the colorbar. The default value is 0.
UVALUE
Set this property to an IDL variable of any data type.
WINDOW (Get Only)
This property retrieves a reference to the WINDOW object that contains the graphic.
Continuous versus Discrete Colorbars
The COLORBAR function can be used to create either continuous or discrete colorbars. Colorbars created from an IMAGE or VECTOR will be "continuous", using the RGB table associated with the image. Colorbars created from a CONTOUR plot will be "discrete", with each color box (or swatch) corresponding to a different contour level. For example, the following code creates two different contour plots (filled and unfilled), both of which produce discrete colorbars.
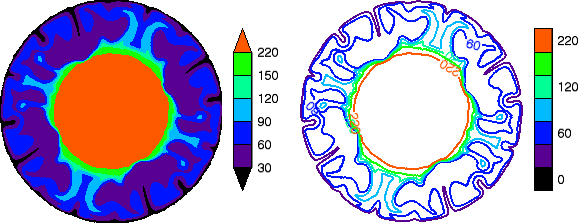
file = FILEPATH('convec.dat', SUBDIR=['examples', 'data'])
z = READ_BINARY(file,DATA_DIMS=[248,248])
index = [0,30,60,90,120,150,220]
c1 = CONTOUR(z, /FILL, ASPECT_RATIO=1, DIM=[600,300], $
RGB_TABLE=39, RGB_INDICES=index, C_VALUE=index, $
LAYOUT=[2,1,1], AXIS_STYLE=0, MARGIN=[0,0.1,0.25,0.1])
cb = COLORBAR(TARGET=c1, /BORDER, ORIENTATION=1, $
TEXTPOS=1, POSITION=[0.39,0.25,0.42,0.75])
c2 = CONTOUR(z, C_THICK=2, ASPECT_RATIO=1, /CURRENT, $
RGB_TABLE=39, RGB_INDICES=index, C_VALUE=index, $
LAYOUT=[2,1,2], AXIS_STYLE=0, MARGIN=[0,0.1,0.25,0.1])
cb = COLORBAR(TARGET=c2, /BORDER, ORIENTATION=1, $
TEXTPOS=1, POSITION=[0.89,0.25,0.92,0.75], $
TICKNAME=['0','','60','','120','','220'])
Colorbars created from scratch (without a TARGET) may be either continous or discrete. By default, the COLORBAR function uses the RGB_TABLE property to create a colorbar with a continuous range of N colors that spans the RANGE. The TICKVALUES and TICKNAME properties are then used to label the colorbar axis. To create a "discrete" colorbar, you should set the TICKNAME property to a string array with exactly N or N+1 elements, where N is the number of colors specified by the RGB_TABLE property. If TICKNAME has N elements then the labels will be centered underneath each color swatch in the colorbar. If TICKNAME has N+1 elements then the labels will be centered underneath the lines between each color.
The following code creates a variety of colorbars from scratch.
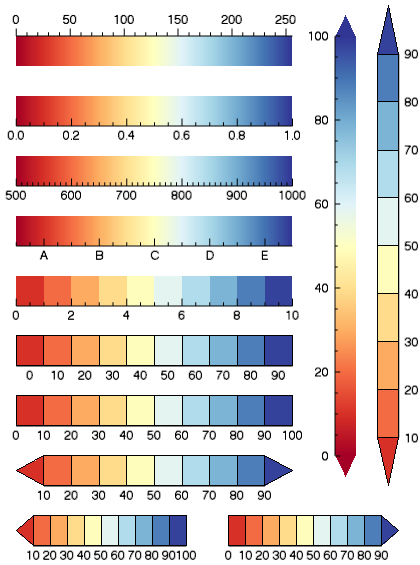
w = WINDOW(DIMENSIONS=[400,600])
cb = COLORBAR(POSITION=[0.05,0.85,0.7,0.9], $
RGB_TABLE=72, TEXTPOS=1)
cb = COLORBAR(POSITION=[0.05,0.75,0.7,0.8], $
RGB_TABLE=72, RANGE=[0,1])
cb = COLORBAR(POSITION=[0.05,0.65,0.7,0.7], $
RGB_TABLE=72, RANGE=[500,1000])
cb = COLORBAR(POSITION=[0.05,0.55,0.7,0.6], $
RGB_TABLE=72, RANGE=[500,1000], $
TICKVALUES=[550,650,750,850,950], $
TICKNAME=['A','B','C','D','E'])
cb = COLORBAR(POSITION=[0.8,0.2,0.85,0.9], TAPER=1, $
RGB_TABLE=72, RANGE=[0,100], ORIENTATION=1)
LOADCT, 72, RGB_TABLE = rgb
rgb = rgb[25 + 25*INDGEN(10), *]
cb = COLORBAR(POSITION=[0.05,0.45,0.7,0.5], RGB_TABLE=rgb)
tickname = STRING(10*INDGEN(10), FORMAT='(I0)')
cb = COLORBAR(POSITION=[0.05,0.35,0.7,0.4], RGB_TABLE=rgb, $
TICKNAME=tickname, BORDER=1)
tickname = STRING(10*INDGEN(11), FORMAT='(I0)')
cb = COLORBAR(POSITION=[0.05,0.25,0.7,0.3], RGB_TABLE=rgb, $
TICKNAME=tickname, BORDER=1)
cb = COLORBAR(POSITION=[0.05,0.15,0.7,0.2], RGB_TABLE=rgb, $
TICKNAME=tickname, BORDER=1, TAPER=1)
cb = COLORBAR(POSITION=[0.05,0.05,0.45,0.1], RGB_TABLE=rgb, $
TICKNAME=tickname, BORDER=1, TAPER=2)
cb = COLORBAR(POSITION=[0.55,0.05,0.95,0.1], RGB_TABLE=rgb, $
TICKNAME=tickname, BORDER=1, TAPER=3)
cb = COLORBAR(POSITION=[0.9,0.15,0.95,0.95], RGB_TABLE=rgb, $
TICKNAME=tickname, BORDER=1, TAPER=1, $
ORIENTATION=1, TEXTPOS=1)
Version History
|
8.0 |
Introduced. |
|
8.1 |
Added the UVALUE property.
Added the Delete method.
|
|
8.2 |
Rename BORDER_ON property to BORDER. Added RANGE, RGB_TABLE, TAPER, and TEXT_ORIENTATION properties.
|
|
8.4 |
Allow TAPER to work with continuous colorbars.
|
| 8.6 |
Changed default font name and font size. |
See Also
!COLOR, COLORTABLE, Formatting IDL Graphics Symbols and Lines, IMAGE, Loading a Default Color Table,
SURFACE, Using IDL graphics