The CONTOUR function draws a two-dimensional contour plot for a 2D array of data.
Instead of data, you can also input an equation of X and Y using either the input argument or the EQUATION property. In this case IDL will automatically generate the independent X and Y values and use your equation to compute the dependent Z data.
Example
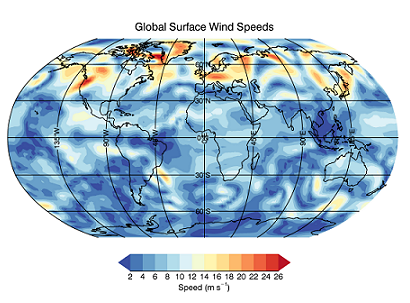
The following lines of code create the graphic shown.
file = FILE_WHICH('globalwinds.dat')
RESTORE, file, /VERBOSE
s = SQRT(u^2 + v^2)
conversion = IDLUNIT('1 mile / hour') / IDLUNIT('meter / second')
s *= conversion.quantity
m = MAP('Robinson', renderer = 1)
ct = COLORTABLE(72, /reverse)
c = CONTOUR(s, x, y, $
/FILL, $
OVERPLOT=m, $
GRID_UNITS='degrees', $
RGB_TABLE=ct, $
TITLE='Global Surface Wind Speeds')
mc = MAPCONTINENTS()
cb = COLORBAR(TITLE='Speed ($m s^{-1}$)')
Additional Examples
See Surface and contour examples and Model the Study Area and Setting for additional examples using the CONTOUR function.
Syntax
graphic = CONTOUR(Data [, X, Y] [, Keywords=value] [, Properties=value] [, Map Properties=value] [, Map Grid Properties=value] )
graphic = CONTOUR(Equation [, Keywords=value] [, Properties=value] [, Map Properties=value] [, Map Grid Properties=value] )
Keywords
Keywords are applied only during the initial creation of the graphic.
AXIS_STYLE=value
/BUFFER, /CURRENT, /DEVICE, DIMENSIONS=[width, height], DRAG_QUALITY=quality, LAYOUT=array, LOCATION=[x, y], MARGIN=scalar or [left, bottom, right, top], /NO_TOOLBAR, /NODATA, /OVERPLOT, /WIDGETS
/IRREGULAR
Properties
Properties can be set as keywords to the function during creation, or retrieved or changed using the "." notation after creation.
ANTIALIAS, ASPECT_RATIO, ASPECT_Z, AXES, BACKGROUND_COLOR, BACKGROUND_TRANSPARENCY, C_COLOR, C_FILL_PATTERN, C_LABEL_INTERVAL, C_LABEL_NOGAPS, C_LABEL_OBJECTS, C_LABEL_SHOW, C_LINESTYLE, C_THICK, C_USE_LABEL_COLOR, C_USE_LABEL_ORIENTATION, C_VALUE, CLIP, COLOR, CROSSHAIR, DAYS_OF_WEEK, DEPTH_CUE, DOWNHILL, EQN_SAMPLES, EQN_USERDATA, EQUATION, EYE, FILL, FONT_COLOR, FONT_NAME, FONT_SIZE, FONT_STYLE, GRID_UNITS, HIDE, LABEL_COLOR, LABEL_FORMAT, LABEL_FRMTDATA, LABEL_UNITS, MAPGRID, MAPPROJECTION, MAP_PROJECTION, MAX_VALUE, MIN_VALUE, MONTHS, NAME, N_LEVELS, PERSPECTIVE, PLANAR, POSITION, RGB_INDICES, RGB_TABLE, SHADE_RANGE, SHADING, TICKINTERVAL, TICKLEN, TITLE, TRANSPARENCY, USE_TEXT_ALIGNMENTS, UVALUE, VERT_COLORS, WINDOW, WINDOW_TITLE, XRANGE, YRANGE, ZCLIP, ZRANGE, ZVALUE
Methods
Close
ConvertCoord
CopyWindow
Delete
Erase
GenerateCode
GetData
GetValueAtLocation
MapForward
MapInverse
Order
Print
Refresh
Rotate
Save
Scale
Select
SetData
Translate
Return Value
The CONTOUR function returns a reference to the created graphic. Use the returned reference to manipulate the graphic after creation by changing properties or calling methods.
Arguments
Data
A vector or two-dimensional array containing the contour data. If Data is a vector, then X and Y should also be vectors of the same length, containing the x and y coordinate of the corresponding points.
X
A vector or 2D array containing the x-coordinates of the data.
If Data is a 2D array and X is a vector, then each element of X specifies the x-coordinate for a column of Data.
If X is a two-dimensional array, then each element specifies the x-coordinate of the corresponding point in Data.
Y
A vector or 2D array containing the y-coordinates of the data.
If Data is a 2D array and Y is a vector, then each element of Y specifies the y-coordinate for a row of Data.
If Y is a two-dimensional array, then each element specifies the y-coordinate of the corresponding point in Data.
Automatic Gridding
If Data, X, and Y are vectors with the same number of elements, then the data is assumed to be irregularly spaced. If Data, X, and Y are two-dimensional arrays with the same number of elements, then the X and Y coordinates will be tested to determine if the points are regularly or irregularly spaced.
In either case, if the data are irregularly spaced, then IDL will automatically grid the data so that the points lie on a regular grid. The gridding is done using the following steps:
- IDL calls the QHULL procedure to construct the Delaunay triangulation. If GRID_UNITS="degrees" then the data is assumed to lie on a sphere, and the SPHERE keyword is passed into QHULL.
- The graphics function then constructs an output grid. The number of points in the X and Y dimensions is automatically determined from the average number of points in the original X and Y data. IDL then evenly distributes these points across the corresponding range of the X and Y coordinates.
- IDL calls the GRIDDATA function, using the Delaunay triangulation and the regular grid. For speed, the Natural Neighbor method is used.
- For non-spherical data, we then compare the interpolated data to the minimum and maximum of the original data. Data points are assumed to be "poorly" interpolated if they lie outside of 10% below the minimum or 10% above the maximum of the original data. If more than 10% of the points are poorly interpolated then IDL throws an error and halts execution. Otherwise, IDL passes the bad data points back into GRIDDATA and uses the Linear method, which is slower but more accurate.
Notes
- You can pass in a named variable to the IRREGULAR keyword to determine if automatic gridding was performed.
- You can retrieve the gridded results using the ::GetData method.
- Depending upon the dataset, the automatic gridding may fail or may produce displeasing results. In this case you should do the gridding yourself, perhaps using a different gridding method to GRIDDATA.
Equation
If the first argument is a string, then it is assumed to represent either an equation of X or the name of an IDL function that accepts an input argument X. Setting this argument is the same as setting the EQUATION property. See EQUATION for details.
Keywords
Keywords are applied only during the initial creation of the graphic.
AXIS_STYLE
Set this keyword to one of the following values:
- 0 - No axes. Decrease the margins so the graphic almost fills the window. This is the default for images.
- 1 - Single X, Y (and Z if 3D) axes located at the minimum data value. The margins will be adjusted to leave space for the axes. This is the default for 3D graphics.
- 2 - Box axes - multiple axes located at both the minimum and maximum data values. The margins will be adjusted to leave space for the axes. This is the default for 2D graphics.
- 3 - Crosshair-style axes - located at the midpoint of each data dimension. Since the axes are in the middle, decrease the margins so the graphic almost fills the window. This is the default for polar plots.
- 4 - No axes, but use the same margins as if axes were there. This is useful if you want to later add another graphic that does have axes, and you want the two visualizations to be aligned properly.
You can set the following properties on the axes:
|
Property |
Description |
|
[XYZ]COLOR |
A string or RGB vector containing the axis color.
|
|
[XYZ]GRIDSTYLE |
A string, integer, or 2-element vector giving the linestyle for tickmarks.
|
|
[XYZ]LOG |
Set to 1 if the axis is logarithmic. The minimum value of the axis range must be greater than zero.
|
|
[XYZ]MAJOR |
The number of major tick marks. Set to -1 to auto-compute, set to 0 to suppress.
|
|
[XYZ]MINOR |
The number of minor tick marks. Set to -1 to auto-compute, set to 0 to suppress.
|
|
[XYZ]SUBGRIDSTYLE
|
A string, integer, or 2-element vector giving the linestyle for the minor tickmarks. The default is 0, for solid lines. Set to -1 to force minor ticks to have the same linestyle as major ticks.
|
|
[XYZ]SHOWTEXT |
Set to 1 to show text labels or 0 to hide the text labels.
|
|
[XYZ]STYLE |
The axis range style. The valid values are:
(0) Nice range. Default for all graphics except Image, Barplot, and Map.
(1) Force the exact data range. Default for Image, Barplot, and Map.
(2) Pad the axes slightly beyond the nice range.
(3) Pad the axes slightly beyond the exact data range.
The [XYZ]RANGE takes precedence over this property.
|
|
[XYZ]SUBTICKLEN |
The ratio of the minor tick length to the major tick length. The default is 0.5.
|
|
[XYZ]TEXT_COLOR |
A string or RGB vector containing the axis text color.
|
|
[XYZ]TEXT_ORIENTATION
|
The angle (in degrees) of the tick mark labels.
|
|
[XYZ]TEXTPOS |
Set to 1 to position text above the axis. The default is 0, below the axis.
|
|
[XYZ]THICK |
Set to a floating-point value between 0 and 10 to specify the line thickness for tickmarks. A thickness of 0 gives a thin hairline. The default is 1.
|
|
[XYZ]TICKDIR |
Set to 1 to draw the tickmarks facing outwards. The default is 0, facing inwards.
|
|
[XYZ]TICKFONT_NAME
|
A string containing the font name for the axis text.
|
|
[XYZ]TICKFONT_SIZE
|
The axis text size in points.
|
|
[XYZ]TICKFONT_STYLE
|
A string or integer containing the font style: normal (0), bold (1), italic (2), or bold italic (3).
|
|
[XYZ]TICKFORMAT |
A string or string array of tick label formats. See Format Codes for more information.
|
|
[XYZ]TICKINTERVAL
|
The interval between major tick marks.
|
|
[XYZ]TICKLAYOUT |
Set to 1 to suppress tick marks; set to 2 to draw a box around the tick labels.
|
|
[XYZ]TICKLEN |
The length of each major tick mark, normalized to the width or height of the graphic. The default value is automatically calculated based upon the aspect ratio of the graphic.
|
|
[XYZ]TICKNAME |
A string array containing the tick labels.
|
|
[XYZ]TICKUNITS |
A string giving the tick units. Valid values are: null (the default, signified by empty quotes), Years, Months, Days, Hours, Minutes, Seconds, Time, exponent for exponential notation, or scientific for scientific notation.
If any of the time units are utilized, then the tick values are interpreted as Julian date/time values. If more than one unit is provided, the axis will be drawn with multiple levels.
|
|
[XYZ]TICKVALUES |
An array of tick mark locations.
|
|
[XYZ]TITLE |
A string giving the axis title.
|
|
[XYZ]TRANSPARENCY
|
An integer from 0-100 giving the percent transparency.
|
For more detailed explanations of these properties, see the AXIS function.
Tip: You can also use the AXIS function to insert additional axes after the graphic has been created.
BUFFER
Set this keyword to 1 to direct the graphics to an off-screen buffer instead of creating a window.
CURRENT
Set this keyword to create the graphic in the current window with a new set of axes. If no window exists, a new window is created. The WINDOW's SetCurrent method may be used to set the current window.
Or, set this keyword to an existing IDL Graphic reference to make that window be the current window and direct the new graphic to that window.
Tip: The CURRENT keyword is usually used with the LAYOUT keyword or POSITION property to produce a window which has multiple graphics in different locations.
Tip: For the graphic share the same axes as an existing graphic, use the OVERPLOT keyword instead.
DEVICE
Set this keyword if values are specified in device coordinates (pixels) for the MARGIN and POSITION keywords. (Normalized coordinates are the default for these keywords.)
DIMENSIONS
Set this keyword to a two-element vector of the form [width, height] to specify the window dimensions in pixels. If you do not specify a value for DIMENSIONS, IDL by default uses the values of the IDL_GR_WIN_HEIGHT and IDL_GR_WIN_WIDTH preferences for Windows platforms or the IDL_GR_X_HEIGHT and IDL_GR_X_WIDTH preferences for X Windows systems on UNIX.
Tip: The minimum width is set by the toolbar in the window, usually around 400 pixels. To create a smaller graphics window, use the NO_TOOLBAR keyword.
DRAG_QUALITY
Set this keyword to 0, 1, or 2 to control the rendering quality and performance during moves, transformations, and rotations initiated with the mouse. The default value is 2, which maintains full rendering quality during mouse interactions. Set to 1 to reduce the drawing quality, or to 0 to further reduce or in some cases disable drawing during dragging or resizing.
LAYOUT
Set this keyword to a three-element vector [ncol, nrow, index] that arranges graphics in a grid. The first dimension ncol is the number of columns in the grid, nrow is the number of rows, and index is the grid position at which to place the graphic (starting at element 1). This keyword is ignored if either OVERPLOT or POSITION is specified.
LOCATION
Set this keyword to a two-element vector [X offset, Y offset] giving the window's screen offset in pixels.
MARGIN
Set this keyword to the current graphic’s margin values in the layout specified by the LAYOUT property. Use a scalar value to set the same margin on all sides, or use a four-element vector [left, bottom, right, top] to specify different margins on each side.
By default, margin values are expressed in normalized units ranging from 0.0 to 0.5. If the DEVICE keyword is set, the values are given in device units (pixels).
This keyword is ignored if either OVERPLOT or POSITION is specified.
NO_TOOLBAR
By default the graphics window will have a toolbar containing some common tools such as Print and Save. Set this keyword to remove the toolbar. This keyword has no effect if the window is already created.
Tip: When the toolbar exists, the minimum window width is set to the toolbar's width, usually around 400 pixels. To create a smaller graphics window, use the NO_TOOLBAR keyword.
NODATA
Set this keyword to 1 to create the graphic, but without any data attached to it. The axes and title (if present) are also created and displayed. If the OVERPLOT keyword is specified, axis ranges will not change.
Note: You must still provide valid input arguments. The data range of the input arguments are used to automatically set the range of the axes. The [XYZ]RANGE properties may be used to override these default ranges.
OVERPLOT
Set this keyword to 1 (one) to place the graphic on top of the currently-selected graphic within the current window. The two graphics items will then share the same set of axes. If no current window exists, then this keyword is ignored and a new window is created.
If you have a graphic in another window that is not currently selected, you can also set this keyword to that graphic's reference to overplot on top of that graphic.
Tip: For the graphic to have a new set of axes, use the CURRENT keyword instead.
WIDGETS
By default, when running from the IDL Workbench, the graphics window will use the native widgets for your platform. Set this keyword to instead use IDL widgets for the graphics window. This keyword is ignored when running from the IDL command line, since IDL widgets are always used in that case.
IRREGULAR
Set this keyword to 1 to force the data to be gridded onto a regular grid. Set this keyword to 0 to disable automatic gridding. By default, if this keyword is not specified, then IDL will automatically grid the data if the X and Y locations are not on a 2D grid.
Note: The X and Y locations do not need to be evenly spaced. As long as the locations are monotonically increasing (or decreasing) for each individual column and row, then IDL does not need to do any gridding. This is in contrast to IMAGE and SURFACE, where the locations must be evenly spaced.
Properties
ANTIALIAS
By default anti-aliasing is used when drawing lines. Set this property to 0 to disable anti-aliasing.
ASPECT_RATIO
A floating point value indicating the ratio of the Y dimension to the X dimension in data units. If this property is set to a nonzero value, the aspect ratio will be preserved as the graphic is stretched or shrunk. The default value is 0 for all graphics except images, meaning that the aspect ratio is not fixed, but is allowed to change as the graphic is stretched or shrunk.
ASPECT_Z
For 3-D graphics, a floating point value indicating the ratio of the Z dimension to the X and Y dimensions, in data units. If this is a nonzero value, the aspect ratio will be preserved as the graphic is stretched or shrunk. The default value is 0, meaning that the aspect ratio is not fixed, but is allowed to change as the graphic is stretched or shrunk.
AXES (Get Only)
This property retrieves an array that contains all of the AXIS objects within the visualization. For example, for a plot visualization:
p = PLOT(/TEST)
ax = p.AXES
ax[0].TITLE = 'X axis'
ax[1].TITLE = 'Y axis'
ax[2].HIDE = 1
ax[3].HIDE = 1
See AXIS for a list of the available properties.
BACKGROUND_COLOR
Set this property to a string or RGB vector indicating the graphic's background color. The default value is [255, 255, 255] (white). Set this property to a scalar value to remove the background color.
Tip: To set the background color of the entire window, retrieve the window object using the WINDOW property, and set the BACKGROUND_COLOR on the window object.
BACKGROUND_TRANSPARENCY
Set this property to an integer between 0 and 100 giving the percent transparency of the background color. The default is 100 (completely transparent).
Note: If the BACKGROUND_COLOR property is changed, and the current background transparency is 100, then the BACKGROUND_TRANSPARENCY will be automatically set to 0 (opaque) so that you can see the new color.
C_COLOR
Set this property to a string array of color names, a 3 x N array of RGB color values, or a 4 x N array of RGBA color values representing the colors for each contour level. If there are more contour levels than elements in this vector, the colors will be repeated cyclically. If C_COLOR is set to 0, all contour levels will be drawn in the color specified by the COLOR property (this is the default).
Note: For RGBA values, the fourth value (the opacity) should range from 0 (transparent) to 255 (opaque).
Tip: Instead of C_COLOR, you can also use RGB_INDICES and RGB_TABLE to select colors from a predefined table.
C_FILL_PATTERN
Set this property to an array of IDLgrPattern objects representing the patterns to be applied at each contour level if the FILL property is non-zero. If there are more contour levels than fill patterns, the patterns will be cyclically repeated. If this property is set to 0, all contour levels are filled with a solid color (this is the default).
C_LABEL_INTERVAL
Set this property to a vector of values indicating the distance (relative to the length of each contour path) between labels for each contour level. If the number of contour levels exceeds the number of provided intervals, the values will be repeated cyclically. The default is 0.4.
C_LABEL_NOGAPS
Set this property to a vector of values indicating whether gaps should be computed for the labels at the corresponding contour value (so that the contour line does not pass through the label). A zero value indicates that gaps will be computed for labels at that contour value (this is the default); a non-zero value indicates that no gaps will be computed for labels at that contour value. If the number of contour levels exceeds the number of elements in this vector, the values will be repeated cyclically.
C_LABEL_OBJECTS
Set this property to an array of object references to provide examples of labels to be drawn for each contour level. The objects specified via this property must inherit from either IDLgrSymbol
or IDLgrText. If a single IDLgrText object is provided, each of its strings will correspond to a contour level. If a vector of objects is used, any IDLgrText objects should have only a single string; each object will correspond to a contour level.
By default, with C_LABEL_OBJECTS set equal to a null object, IDL computes text labels that are the string representations of the corresponding contour level values.
The contour labels will have the same color as their contour level (see C_COLOR) unless the C_USE_LABEL_COLOR property is specified. The orientation of the label will be automatically computed unless the C_USE_LABEL_ORIENTATION property is specified. The horizontal and vertical alignment of any text labels will default to 0.5 (i.e., centered) unless the USE_TEXT_ALIGNMENTS property is specified.
Note: The objects specified via this property are used as descriptors only. The actual objects drawn as labels are generated by IDL.
C_LABEL_SHOW
Set this property to a scalar 1 to label all contour levels, 0 to refrain from labeling the levels, or to a vector of 0's or 1's. For each contour value, if the corresponding value in the C_LABEL_SHOW vector is non-zero, the contour line for that contour value will be labeled. If the number of contour levels exceeds the number of elements in this vector, the values will be repeated cyclically. The default is to label every other contour line (i.e., C_LABEL_SHOW = [1,0,1,0]).
C_LINESTYLE
Set this property to an array of strings or integers representing the linestyle of each contour level. If this property is set to 0, all levels are drawn as solid lines (this is the default).
The allowed values are:
|
Index |
String (case insensitive)
|
|
0 |
'solid' or '-'(dash)
|
|
1 |
'dot' or ':'(colon)
|
|
2 |
'dash' or '--' (double dashes)
|
|
3 |
'dash dot' or '-.'
|
|
4 |
'dash dot dot dot' or '-:'
|
|
5 |
'long dash' or '__' (double underscores)
|
|
6 |
'none' or ' ' (space)
|
C_THICK
Set this property to an array representing the thickness (between 1 and 10 points) to be applied at each contour level. If there are more contour levels than values, the values will be cyclically repeated. If this property is omitted or set to 0, all contour levels are drawn with a line thickness of 1 point.
C_USE_LABEL_COLOR
Set this property to a vector of values (0 or 1) to indicate whether the COLOR property value for each of the label objects (for the corresponding contour level) is to be used to draw that label. If the number of contour levels exceeds the number of elements in this vector, the values will be repeated cyclically. By default, this value is zero, indicating that the COLOR properties of the label objects will be ignored, and the C_COLOR property for the contour object will be used instead.
C_USE_LABEL_ORIENTATION
Set this property to a vector of values (0 or 1) to indicate whether the orientation for each of the label objects (for the corresponding contour level) is to be used when drawing the label. For text, the orientation of the object corresponds to the BASELINE and UPDIR property values; for a symbol, this refers to the default (un-rotated) orientation of the symbol. If the number of contour levels exceeds the number of elements in this vector, the values will be repeated cyclically. By default, this value is zero, indicating that orientation of the label objects will be automatically computed to correspond to the direction of the contour paths.
C_VALUE
Set this property to a scalar value or a vector of values for which contour levels are to be drawn. If this property is set to 0, contour levels will be evenly sampled across the range of the data argument, using the value of the N_LEVELS property to determine the number of samples. IDL converts, maintains, and returns this data as double-precision floating-point.
Note: Depending upon your data, certain contour levels given in C_VALUE may not actually be displayed. For example, for line contour plots, if your lowest C_VALUE matches the lowest data value, this contour line will not be drawn.
CLIP
Set this property to 1 to clip portions of the graphic that lie outside of the dataspace range, or to 0 to disable clipping. The default is 1.
COLOR
Set this property to a string or RGB vector giving the contour color. The default colortable for line contours is 55, and for filled contours the default is 49 (reversed).
Note: When you retrieve the COLOR property, the returned value will always be a three-element RGB vector, regardless of how the color was initially specified.
This value will be ignored if the C_COLOR property is set to a vector.
CROSSHAIR (Get Only)
Use this property to retrieve a reference to the Crosshair graphic. All graphics objects within the same set of axes share a single Crosshair graphic. For Plot graphics the default behavior is to display the crosshair when a Mouse_Down event is received. For other graphics the crosshair is disabled. The STYLE property may be used to automatically draw the crosshair, while the LOCATION property may be used to manually draw the crosshair.
You can get and set the following properties on the retrieved crosshair:
|
Property |
Description |
|
ANTIALIAS |
Set to 1 to enable anti-aliasing for the lines.
|
|
COLOR |
A string or RGB vector containing the color.
|
|
HIDE |
Set to 1 to hide the crosshair, 0 to show.
|
|
INTERPOLATE |
Set to 1 to force interpolation between Plot data points when SNAP is active. For other graphics this property is ignored. The default is 0.
|
|
LINESTYLE |
An integer or string giving the line style. The default is 'dot'. See Linestyle Values for additional options.
|
|
LOCATION |
The location at which to draw the crosshair. For Plot graphics, if SNAP is enabled, then only the X coordinate needs to be supplied. Otherwise, LOCATION should be set to a two-element vector [X, Y] for two-dimensional graphics or [X, Y, Z] for three-dimensional graphics. If STYLE is currently "None", then setting the LOCATION will automatically set the STYLE to "Manual".
|
|
NAME |
The name of the graphic.
|
|
SNAP |
Set to 1 to snap the crosshair to the nearest Plot data point. For other graphics this property is ignored. The default is 1.
|
|
STYLE |
An integer or string giving the crosshair style. Possible values are:
0 - "None" - never draw the crosshair. This is the default for all graphics except 2D plots.
1 - "Manual" - draw the crosshair using the LOCATION property.
2 - "Auto" - automatically draw the crosshair. This is the default for 2D plots.
|
|
THICK |
The thickness of the lines. The default is 1.
|
|
TRANSPARENCY |
The percent transparency of the lines. The default is 50.
|
|
UVALUE |
An IDL variable of any data type.
|
For example, use the CROSSHAIR property to draw a crosshair on an image:
im = IMAGE(/TEST, TRANSPARENCY=50, AXIS_STYLE=2)
c = im.CROSSHAIR
c.COLOR = 'red'
c.THICK = 2
c.LOCATION = [300, 200]
See Creating Functions to Control Mouse Events for a more detailed crosshair example.
DAYS_OF_WEEK
Set this property to a vector of 7 strings to indicate the names to be used for the days of the week when processing explicitly formatted dates with the LABEL_FORMAT property.
DEPTH_CUE
Set this property to a two-element vector [bright, dim] specifying the near and far planes for depth cueing, in normalized units. Depth cueing causes graphics objects that are further away to fade into the background. The first element is where the fade starts to take effect, while the second element is where the objects are completely transparent. Negative values are closer to the eye, while positive values are farther from the eye. The default value is [0, 0] which disables depth cueing. A typical value would be [0, 1], which would cause objects to start to fade at the mid-plane of the window, and completely fade out at a normalized eye distance of 1.
DOWNHILL
Set this property to indicate that tick marks should be drawn on each contour level to indicate the downhill direction relative to the contour line.
EQN_SAMPLES
Set this property to a scalar or two-element array giving the number of samples to use in the X and Y dimensions with the EQUATION property. If a scalar is specified then the same value is used for both dimensions. A higher value will give a smoother contour but will be slower to compute. The default is 200 points in each dimension. This property has no effect if EQUATION is not set.
EQN_USERDATA
Set this property to an expression containing data of any type. If EQUATION is set to a function and EQN_USERDATA is set, then the value of EQN_USERDATA will be passed in as the third argument to the function. If EQUATION is not set, or if EQUATION is set to an expression of X and Y, then this property will have no effect.
EQUATION
Set this property to a string that contains an equation. The equation can either be a valid IDL statement that has variables named "x" and "y", or the name of a function that accepts two arguments, X and Y. Note that your IDL statement (or function) must be able to handle two-dimensional arrays of X and Y values. In other words, all of the X and Y values are passed in at once, not individually. The result of evaluating the equation with X and Y should be another two-dimensional array containing the data to be contoured.
- When the contour plot is displayed, IDL will automatically construct two-dimensional arrays X and Y that span the current axis ranges.
- The initial range is [-10, 10] in both X and Y.
- If EQUATION is an expression, then IDL calls the EXECUTE function once with the X and Y arrays. Note that in certain circumstances (such as the IDL Virtual Machine), you may not be able to use the EXECUTE function.
- If EQUATION is a function name, then CALL_FUNCTION is called once with the X and Y arrays as input arguments. The function should return a two-dimensional result array.
- Once the equation is evaluated, IDL examines the result for any NaN values, and then the X and Y ranges are clipped to only cover valid regions.
- The equation should be a "single" IDL statement (the "&" can not be used). If you need multiple statements, you should construct a function that accepts two arguments, X and Y, and put all of your code within the function.
- If you change the X and Y axis ranges (either by using the mouse to pan around or using the XRANGE or YRANGE properties), then a new set of X and Y values is constructed and IDL calls your equation again with the new values.
- You can use EQN_SAMPLES to control the number of sampled points in each dimension.
- You can use EQN_USERDATA to pass in user-defined data to your function.
Example of EQUATION Property with an Expression
The following code will produce a contour plot with a given equation:
c = CONTOUR('COS(SIN(x*y/4) + COS(x/2))', /FILL, RGB_TABLE=74)
Example of EQUATION Property with a Function
To use the EQUATION property with a function, first create the function and save it into a file named ex_contourequation.pro somewhere on IDL's current path:
FUNCTION ex_contourequation, x, y
data = COS(SIN(x*y/4) + COS(x/2))
RETURN, data
END
Then run the following code to use the equation:
c = CONTOUR('ex_contourequation', /FILL, RGB_TABLE=74)
For a more detailed example see Dynamic Visualizations.
EYE
A floating-point value that specifies the distance from the eyepoint to the viewplane (Z=0). The default is 4.0. The eyepoint is always centered within the viewplane rectangle. IDL converts, maintains, and returns this data as double-precision floating-point.
FILL
Set this property to indicate that the contours should be filled. The default is to draw the contour levels as lines without filling. The default color is defined by color table 49. See Loading a Default Color Table for more information.
Note: When saving to KML file format, the file size can be large. If this is an issue, try saving to KMZ format instead.
FONT_COLOR
Set this property to a string or RGB vector giving the color of the contour labels, title text, and axis text (if present). The default value is "black".
FONT_NAME
Set this property equal to a string specifying the IDL or system font for the contour labels, title text, and axes (if present). The default value is "DejaVuSans".
FONT_SIZE
Set this property equal to an integer specifying the font size for the contour labels, title text, and axes (if present). The default value is 9 points for the contour and axis text and 11 points for the title.
FONT_STYLE
Set this property equal to an integer or a string specifying the font style for the contour labels, title text, and axes (if present). Allowed values are:
|
Integer |
String |
Resulting Style |
|
0 |
"Normal" or "rm"
|
Default (roman) |
|
1 |
"Bold" or "bf" |
Bold |
|
2 |
"Italic" or "it"
|
Italic |
|
3 |
"Bold italic" or "bi"
|
Bold italic |
GRID_UNITS
Set this property to an integer or string specifying the units for the contour grid. This property applies only when there is a map projection. It has the following possible values:
-
0 or "" - None. The contour grid is in arbitrary units that are not tied to a map projection. The data will not be warped to the current map projection.
-
1 or "m" or "meters" - Meters. The contour grid is in meters, and is tied to the x/y coordinates of a particular map projection. The MAP_PROJECTION property (and other map projection properties) should be used to set the appropriate projection. In this case, the data will not be warped, but will be displayed directly on the map.
-
2 or "deg" or "degrees" - Degrees. The contour grid is in degrees longitude/latitude. The MAP_PROJECTION property (and other map projection properties) can be used to set a desired projection. The contour data will then be automatically warped to the map projection.
HIDE
Set this property to 1 to hide the graphic, or 0 to show the graphic.
LABEL_COLOR
Set this property to a string or RGB vector giving the color of the contour labels. If this property is set to a scalar value (-1 for example) then the contour labels will be given the same color as the corresponding contour level. This is the default behavior.
LABEL_FORMAT
Set this property to a string that represents a format string or the name of a function to be used to format the contour labels. If the string begins with an open parenthesis, it is treated as a standard format string (refer to Format Codes). If the string does not begin with an open parenthesis, it is interpreted as the name of a callback function to be used to generate contour level labels.
The callback function is called with three parameters: Axis, Index, and Value and an optional DATA property. Axis is the value 2 to indicate that values along the Z axis are being formatted, which allows a single callback routine to be used for both axis labeling and contour labeling. Index is the contour level index (indices start at 0). Value is the data value of the current contour level. DATA is the optional property allowing any user-defined value specified through the LABEL_FRMTDATA property.
LABEL_FRMTDATA
Set this property to a value of any type. It will be passed via the DATA property to the user-supplied formatting function specified via the LABEL_FORMAT property, if any. By default, this value is 0, indicating that the DATA property will not be passed through.
LABEL_UNITS
Set this property to a string indicating the units to be used for default contour level labeling. Valid values are "" (the default), "Years", "Months", "Days", "Hours", "Minutes", "Seconds", or "Time".
MAPGRID (Get Only)
If a map projection is currently in effect, this property retrieves a reference to the MAPGRID object.
MAPPROJECTION (Get Only)
If a map projection is currently in effect, this property retrieves a reference to the MAPPROJECTION object.
MAP_PROJECTION
A string giving the name of the map projection to be used when creating the graphic. You can use the GRID_UNITS property to specify the units ("none", "meters", or "degrees") for the contour grid. If necessary, the contour data will be warped to the map projection. See below for a list of map projection and map grid properties.
MAX_VALUE
The maximum value to be contoured. If this property is set, data values greater than the value of MAX_VALUE are treated as missing data.
Note: The IEEE floating point value NaN is also treated as missing data.
MIN_VALUE
The minimum value to be contoured. If this property is set, data values less than the value of MIN_VALUE are treated as missing data.
Note: The IEEE floating point value NaN is also treated as missing data.
MONTHS
Set this property to a vector of 12 strings indicating the names to be used for the months when processing explicitly formatted dates with the C_LABEL_FORMAT property.
NAME
A string that specifies the name of the graphic. The name can be used to retrieve the graphic using the brackets array notation. If NAME is not set then a default name is chosen based on the graphic type.
N_LEVELS
Set this property to the number of contour levels to generate. This property is ignored if the C_VALUE property is set to a vector, in which case, the number of levels is derived from the number of elements in that vector. The default is 0, which indicates that IDL should compute a default number of levels based on the data range.
Note: N_LEVELS is just a "hint" to the Contour graphic. The actual number of levels generated by Contour may be less than the value specified by the property. For more control over the actual contour levels, use the C_VALUE property instead.
PERSPECTIVE
Set this property to 1 to enable a perspective graphics projection. In the perspective projection, objects that are further away will appear smaller. The default is 0, which is the orthogonal perspective.
PLANAR
Set this property to indicate that the contoured data is to be projected onto a plane. Unlike the underlying IDLgrContour object, the default for ICONTOUR is planar (PLANAR = 1), which displays the contoured data in a plane. See the ZVALUE property to specify the Z value at which to display the planar Contour plot if it is displayed in a three dimensional data space.
POSITION
Set this property to a four-element vector that determines the position of the graphic within the window. The coordinates [X1, Y1, X2, Y2] define the lower left and upper right corners of the graphic. Coordinates are expressed in normalized units ranging from 0.0 to 1.0. On creation, if the DEVICE keyword is set, the units are given in device units (pixels).
Note: After creation, you can set the POSITION to either a two or four-element vector. If two elements are provided, the center of the graphic will be translated to that position. If four elements are provided, the graphics will be translated and scaled to fit the position.
RGB_INDICES
Set this property to a vector of indices into RGB_TABLE to select colors to use for the contour levels. If the number of colors selected using RGB_INDICES is less than the number of contour levels, the colors are repeated cyclically. If RGB_TABLE is set, but indices are not specified, a default vector of indices is constructed based on the values of the contour levels scaled to the byte range of RGB_TABLE. This property is ignored if C_COLOR is set.
RGB_TABLE
The number of the predefined IDL color table, or a 3 x 256 or 256 x 3 byte array containing color values to use for vertex colors. If the values supplied are not of type byte, they are scaled to the byte range using BYTSCL. Use the VERT_COLORS property to specify indices that select colors from the values specified with RGB_TABLE.
SHADE_RANGE
Set this property to a two-element array that specifies the range of pixel values (color indices) to use for shading. The first element is the color index for the darkest pixel. The second element is the color index for the brightest pixel. This value is ignored if the contour is drawn to a graphics destination that uses the RGB color model.
SHADING
Set this property to 1 to use Gouraud shading, or to 0 (the default) to use flat shading. In flat shading the color has a constant intensity for each face of the contour, based on the normal vector.
In Gouraud shading the colors are interpolated between vertices, and then along scanlines from each of the edge intensities.
Gouraud shading may be slower than flat shading, but results in a smoother appearance.
TICKINTERVAL
Set this property equal to a number indicating the distance between downhill tickmarks, in data units. If TICKINTERVAL is not set, or is set to 0, IDL will compute the distance based on the geometry of the contour.
TICKLEN
Set this property equal to a number indicating the length of the downhill tickmarks, in data units. If TICKLEN is not set, or is set to 0, IDL will compute the length based on the geometry of the contour.
TITLE
Set this property to a string specifying a title. The title properties may be modified using FONT_COLOR, FONT_NAME, FONT_SIZE, and FONT_STYLE. After creation the TITLE property may be used to retrieve a reference to the title text object, and the TEXT properties may be used to modify the title object.
You can add Greek letters and mathematical symbols using a TeX-like syntax, enclosed within a pair of "$" characters. See Adding Mathematical Symbols and Greek Letters to the Text String for details.
TRANSPARENCY
An integer between 0 and 100 that specifies the percent transparency of the plot line. The default value is 0.
USE_TEXT_ALIGNMENTS
Set this property to 1 to indicate that for any text labels (as specified via C_LABEL_OBJECTS), the ALIGNMENT and VERTICAL_ALIGNMENT property values should be honored. The default is 0, indicating that the horizontal and vertical alignments will be set to 0.5, which will produce centered labels.
UVALUE
Set this property to an IDL variable of any data type.
VERT_COLORS
A vector of colors to be used to specify the color of a contour vertex. The vector may be of the form [n*m] or [n, m] where each entry is a color index, or of the form [3,n*m] where each 3-element row is an RGB color, or of the form [4,n*m] where each 4-element row is an RGBA color. To remove vertex colors after they have been set, set VERT_COLORS to a scalar.
If VERT_COLORS is not specified, the entire contour is drawn in the single color provided by the COLOR property, which is the default action. If this property is set to a vector or a two-dimensional array of equal size to the data, these values are indices into a color table that can be specified by the RGB_TABLE property. If more vertices exist than elements in VERT_COLORS, the elements of VERT_COLORS are cyclically repeated.
WINDOW (Get Only)
This property retrieves a reference to the WINDOW object which contains the graphic.
WINDOW_TITLE
Set this property to the title of the IDL Graphic window. The title is displayed in the window's title bar.
XRANGE
A two-element vector giving the X data range to plot. The default behavior is to plot the entire data range.
YRANGE
A two-element vector giving the Y data range to plot. The default behavior is to plot the entire data range.
ZCLIP
A two element floating-point vector representing the near and far clipping planes to be applied to the objects in this view. The vector should take the form [near, far]. By default, these values are [1, -1]. IDL converts, maintains, and returns this data as double-precision floating-point.
ZRANGE
A two-element vector giving the Z data range to plot. The default behavior is to plot the entire data range.
ZVALUE
For a planar contour plot, the height of the Z plane onto which the contour plot is projected. This property will be ignored if PLANAR=0.
Map Projections
You can use the following map projections with the MAP_PROJECTION property:
|
Alaska Conformal
Albers Equal Area
Azimuthal Equidistant
Cylindrical Equal Area
Equidistant Conic
Equirectangular
Geographic
Gnomonic
GOES-R |
Hammer
Hotine Oblique Mercator
Integerized Sinusoidal
Interrupted Goode
Interrupted Mollweide
Lambert Azimuthal
Lambert Conformal Conic
Mercator
Miller Cylindrical
|
Mollweide
Near Side Perspective
Oblated Equal Area
Orthographic
Polar Stereographic
Polyconic
Robinson
Sinusoidal |
Space Oblique Mercator
State Plane
Stereographic
Transverse Mercator
UTM
Van der Grinten
Wagner IV
Wagner VII |
See the Map function for a description of the map projections.
Map Properties
If you use the MAP_PROJECTION property to set the map projection, then you may need to set other properties to define the projection. The following properties may be set:
|
CENTER_LATITUDE
CENTER_LONGITUDE
ELLIPSOID
FALSE_EASTING
FALSE_NORTHING
HEIGHT
HOM_AZIM_ANGLE
HOM_AZIM_LONGITUDE
HOM_LATITUDE1 |
HOM_LATITUDE2
HOM_LONGITUDE1
HOM_LONGITUDE2
IS_JUSTIFY
IS_ZONES
LIMIT
MERCATOR_SCALE
OEA_ANGLE
OEA_SHAPEM |
OEA_SHAPEN
SEMIMAJOR_AXIS
SEMIMINOR_AXIS
SOM_FLAG
SOM_INCLINATION
SOM_LANDSAT_NUMBER
SOM_LANDSAT_PATH
SOM_LONGITUDE |
SOM_PERIOD
SOM_RATIO
SPHERE_RADIUS
STANDARD_PAR1
STANDARD_PAR2
STANDARD_PARALLEL
TRUE_SCALE_LATITUDE
ZONE |
To set these properties after creation, you can use the MAPPROJECTION property to retrieve a reference to the MapProjection object, and then set the properties on that object. See MAP_PROJ_INIT for a description of these properties.
Map Grid Properties
The following map graticule (grid) properties are available on creation:
|
BOX_ANTIALIAS
BOX_AXES
BOX_COLOR
BOX_THICK
CLIP COLOR
FILL_COLOR
FONT_NAME
FONT_SIZE |
FONT_STYLE
GRID_LATITUDE
GRID_LONGITUDE
HIDE
HORIZON_COLOR
HORIZON_LINESTYLE
HORIZON_THICK
LABEL_ALIGN |
LABEL_ANGLE
LABEL_COLOR
LABEL_FILL_BACKGROUND
LABEL_FILL_COLOR
LABEL_FORMAT
LABEL_POSITION
LABEL_SHOW
LABEL_VALIGN |
LATITUDE_MAX
LATITUDE_MIN
LINESTYLE
LONGITUDE_MAX
LONGITUDE_MIN
THICK
TRANSPARENCY
ZVALUE |
To get or set a property after creation, you can use the MAPGRID property to retrieve a reference to the MapGrid, and then get or set properties directly on that object. See the MAPGRID function for a description of these properties.
Additional Examples
Here, we will create two contour plots on top of each other.
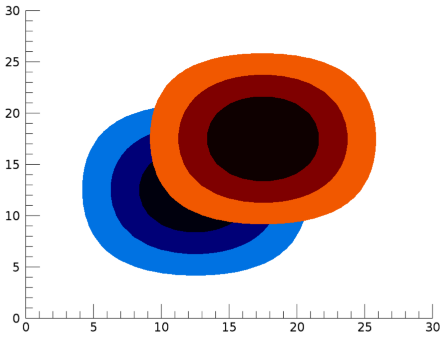
We want three filled contour levels (0–0.25, 0.25–0.5, and 0.5–0.75), so we need to specify four contour values (0, 0.25, 0.5, and 0.75). However, to allow the contours to overlap each other, we do not want the final level (from 0.75–1.0) to be filled, so we will use a transparent color for the final fill.
h = 1 - HANNING(25,25)
x = FINDGEN(25)
v = [0,0.25,0.5,0.75]
c1 = CONTOUR(h, x, x, RGB_TABLE=1, /FILL, C_VALUE=v)
c = c1.c_color
c = [c, 255b + BYTARR(1,(c.dim)[1])]
c[3,3] = 0
c1.c_color = c
c2 = contour(h, x+5, x+5, RGB_TABLE=3, /FILL, C_VALUE=v, /OVERPLOT)
c = c2.c_color
c = [c, 255b + BYTARR(1,(c.dim)[1])]
c[3,3] = 0
c2.c_color = c
Version History
|
8.0 |
Introduced |
|
8.1 |
Added the following properties: CROSSHAIR, MAP_PROJECTION, MAPGRID, MAPPROJECTION, UVALUE, WINDOW, [XYZ]SHOWTEXT, [XYZ]STYLE.
Added the following methods: Delete, GetData, GetValueAtLocation, MapForward, MapInverse, SetData.
|
|
8.2 |
Added AXES, BACKGROUND_COLOR, BACKGROUND_TRANSPARENCY, CLIP properties.
|
|
8.2.1 |
Added ANTIALIAS property.
|
|
8.2.2 |
Change POSITION from a keyword to a property.
Add table of map projection and map grid properties.
Added EYE property.
|
|
8.2.3 |
Added automatic gridding of irregularly-spaced data, and the IRREGULAR keyword.
|
|
8.3 |
Added Equation argument, and EQUATION, EQN_SAMPLES, and EQN_USERDATA properties.
|
| 8.6 |
Changed default font name and font size. |
See Also
!COLOR, Formatting IDL Graphics Symbols and Lines, IMAGE,
SURFACE, Using IDL graphics