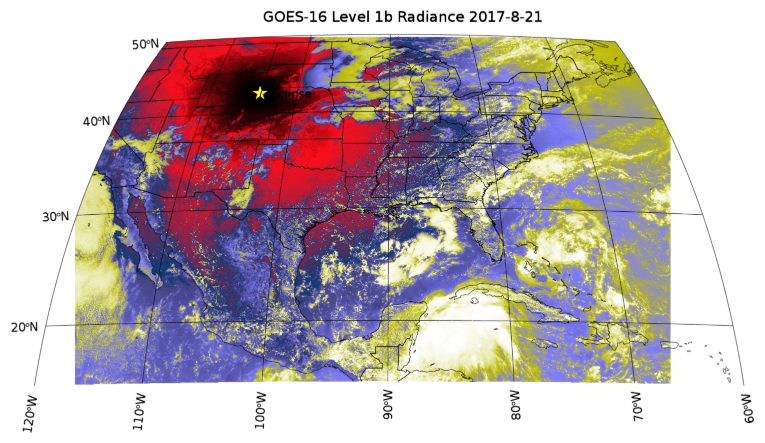
The following example shows how to display GOES-16 data on a map.
The example data is available in the examples/data directory of your IDL installation. The data shows the level 1b radiance data on 21 August 2017. The dark circle over Wyoming is the shadow of the solar eclipse, while the yellow star marks the center of the eclipse at 11:48 MST.
The code below creates the graphic above. You can copy the entire block and paste it into the IDL command line to run it.
file = FILEPATH('GOES16_L1b-RadC_2017-8-21.nc', $
SUBDIR=['examples', 'data'])
data = NCDF_Parse(file, /READ_DATA)
print, 'Time start = ', data['time_coverage_start', '_DATA']
center_lon = data['geospatial_lat_lon_extent', $
'geospatial_lon_nadir', '_DATA']
radiance = data['Rad','_DATA']
xscale = data['x', 'scale_factor', '_DATA']
xoffset = data['x', 'add_offset', '_DATA']
x_radians = data['x', '_DATA']*DOUBLE(xscale) + xoffset
yscale = data['y', 'scale_factor', '_DATA']
yoffset = data['y', 'add_offset', '_DATA']
y_radians = data['y', '_DATA']*DOUBLE(yscale) + yoffset
i = IMAGE(HIST_EQUAL(radiance), x_radians, y_radians, $
RGB_TABLE=15, $
LIMIT=[15,-120, 50, -60], MARGIN=[0.1,0.02,0.08,0.02], $
MAP_PROJECTION='GOES-R', GRID_UNITS='meters', $
CENTER_LONGITUDE=center_lon, $
DIMENSIONS=[1000,600], $
TITLE='GOES-16 Level 1b Radiance 2017-8-21')
mg = i.MapGrid
mg.label_position = 0
mg.clip = 0
mc = MAPCONTINENTS(/COUNTRIES)
mc = MAPCONTINENTS(/US)
s = SYMBOL(-104.14, 42.355, 'Star', /DATA, $
/SYM_FILLED, SYM_COLOR='yellow', SYM_SIZE = 2)
Because the image is already in the GOES-16 projection, we need to specify the projection name (GOES-R), the grid units (meters), and the center longitude.
The NCDF_PARSE function is used to read all of the data into an OrderedHash. Then, the "bracket" notation is used to extract the data from the nested hashes.
Note: The x and y coordinates are actually in GOES-16 "radians", although we still specify "meters" for the units.
Resources