IDL 8.2.2 adds complex functionality to IDL Graphics, provides a new look and new features to Widget programming, and simplified building of custom tools for ENVI.
For links to What's New information for other IDL 8.x releases, go to See Also.
An exciting new development is IDL Help on the Web. View the IDL Documentation Center at https://www.l3harrisgeospatial.com/docs/
Tips and Tricks
We now have a Help topic dedicated to IDL Tips and Tricks. This topic is an ever-expanding compilation of techniques to help you make your programming easier and quicker.
New Features
BOXPLOT
You now have the ability to create box and whiskers plots using the new BOXPLOT function. BOXPLOT creates a traditional box and whiskers plot based on your input array containing a sample minimum, lower quartile, median, upper quartile, and sample maximum. Optional features allow you to plot outlier and suspected outlier values, mean values, and notches. You can define your own data for use in BOXPLOT or employ IDL's new supporting function, CREATEBOXPLOTDATA, to do that for you.
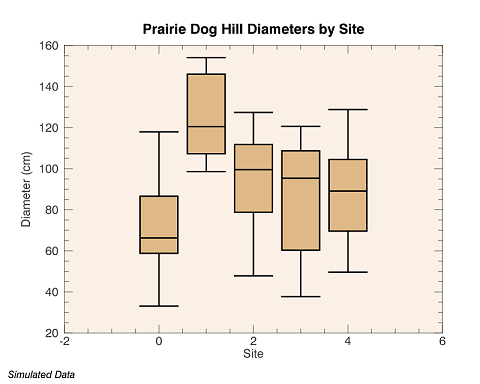
CREATEBOXPLOTDATA
CREATEBOXPLOTDATA is a new function supporting BOXPLOT that takes your raw data and calculates the minimum (excluding possible outliers), the lower quartile, the median, the upper quartile, and the maximum (excluding possible outliers). Optionally, you can use CREATEBOXPLOTDATA to calculate confidence intervals, means, outliers, and suspected outliers.
IMAGE_THRESHOLD
IMAGE_THRESHOLD returns a binary mask that represents whether any given pixel was below (0) or above (1) the calculated threshold value, effectively turning the input into a binary image. You may choose from among several thresholding algorithms: Isodata, Otsu, Moments, Maxentropy, Minerror, and Mean.
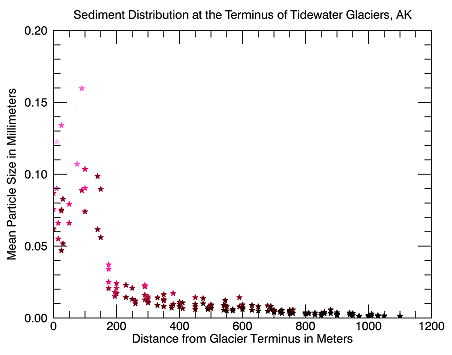
SCATTERPLOT and SCATTERPLOT3D
The new SCATTERPLOT and SCATTERPLOT3D functions display data as a collection of points, plotted using two- or three-dimensional Cartesian coordinates.
TIC and TOC
The TIC and TOC routines allow you to profile the running time of your IDL programs. The TIC routine can be called as either a procedure or a function. When TIC is called as a procedure, the TIC and TOC routines print out the elapsed time between the calls. When TIC is called as a function, the TOC routine measures the elapsed time for that specific call. This allows you to nest the TIC and TOC calls to measure the time within subroutines and loops. The TIC and TOC routines can also be used to enable and disable the IDL code profiler. See TIC and TOC for examples.
Updates
New !CONST System Variable
The new Constant System Variable, !CONST, is an IDL structure that contains commonly-used physical constants. For example, use the Rydberg constant to compute the wavelength of light emitted by atomic transitions in hydrogen:
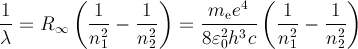
First verify the value of the Rydberg constant:
PRINT, !CONST.me*!CONST.ev^4/(8*!CONST.eps0^2*!CONST.h^3*!CONST.c)
PRINT, !CONST.Rydberg
IDL prints:
10973732.
10973732.
Now compute the transition from the n=2 state to the ground state:
PRINT, 1e9/(!CONST.Rydberg*(1 - 1./4)), " nm"
IDL prints:
121.50227 nm
Random Number Generator
The RANDOMU and RANDOMN functions now use the Mersenne Twister algorithm for generating random numbers. The Mersenne Twister is a significant improvement over the older Numerical Recipes random number generator. The new algorithm has a very long period of 219937 − 1, and is uniformly distributed (to 32-bit accuracy) in any space up to 623 dimensions. If you need to generate random sequences that match sequences from earlier IDL versions, you can use the RAN1 keyword to force RANDOMU and RANDOMN to use the old algorithm. For details see RANDOMU and RANDOMN.
Graphics: CURRENT Keyword
The CURRENT keyword to the graphics functions has been upgraded to allow you to pass in a reference to an existing graphic. That graphic will then become the current graphics window and your newly-created graphics will be inserted into that window.
Graphics: Images with Map Projections
When displaying images that have a map projection, IDL will now automatically set the map limit to the image extent. This allows you to display box axes without having to manually compute the image extent. See Image With Map Projection for an example.
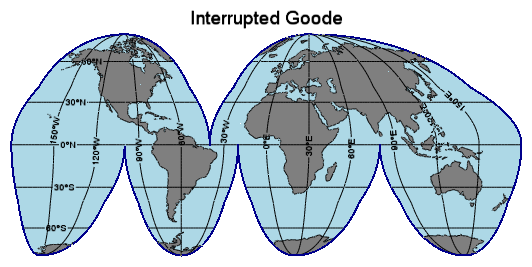
Graphics: Map Horizon
You can now display a map horizon on all map projections. The MAP and MAPGRID functions have three new properties: HORIZON_COLOR, HORIZON_LINESTYLE, and HORIZON_THICK. For example:
mGoode = MAP('Interrupted Goode', FILL_COLOR='light blue', $
HORIZON_COLOR='dark blue', HORIZON_THICK=2, TITLE='Interrupted Goode')
mc = MAPCONTINENTS(/FILL_BACKGROUND, FILL_COLOR='gray')
Graphics: POSITION Property
A new POSITION property has been added to all graphics objects. In earlier versions, you could specify the POSITION keyword to the "main" graphics functions such as PLOT and CONTOUR, to pinpoint the exact position of the graphic within the window. On creation, the position can be set to a four-element vector [X1, Y1, X2, Y2] which defines the lower left and upper right corners of the graphic. After creation, the position can be set to either a two or four-element vector. If two elements are provided, the center of the graphic will be translated to that position. If four elements are provided, the graphics will be translated and scaled to fit the position.
Graphics: Speed Improvements
The startup speed for all graphics functions has been improved. In addition, the speed of the PLOT function has been significantly improved, especially with a large number of points and with hardware rendering enabled. For example, try the following:
n = 1e6
x = RANDOMU(seed, n)
PRINT, 'Graphics functions:'
FOR i=0,2 DO BEGIN & TIC & p = PLOT(x) & TOC & p.CLOSE & ENDFOR
PRINT, 'Direct graphics:'
FOR i=0,2 DO BEGIN & TIC & PLOT, x & TOC & WDELETE & ENDFOR
IDL prints:
Graphics functions:
% Time elapsed: 2.1350000 seconds.
% Time elapsed: 0.65100002 seconds.
% Time elapsed: 0.64999986 seconds.
Direct graphics:
% Time elapsed: 0.84099984 seconds.
% Time elapsed: 0.81699991 seconds.
% Time elapsed: 0.81400013 seconds.
Note that after the graphics code has been compiled, the PLOT function is faster than direct graphics for plots with a large number of points.
IDLgrPlot: New HISTOGRAM Styles
With IDLgrPlot, you can now set HISTOGRAM = 2 to extend the "stairstep" lines past the ends of the data. Alternatively, set HISTOGRAM = 3 to make the horizontal lines start at each X location instead of being centered.
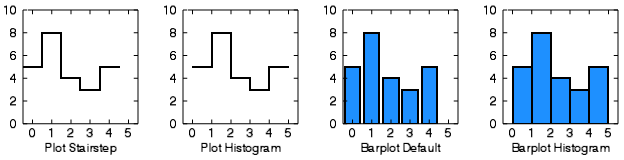
PLOT and BARPLOT: New Histogram Styles
Both PLOT and BARPLOT have a new HISTOGRAM property that draws horizontal and vertical lines. The horizontal bars start at each X location and extend across each bin. In addition, PLOT has a new STAIRSTEP property, which draws horizontal and vertical lines, where the horizontal bars are centered at each X location. For example, the following code produces four different views of the same histogram data.
h = HISTOGRAM(5*RANDOMU(1,25), BINSIZE=1, MIN=0.0, LOCATIONS=loc)
ex = {THICK:2, XRANGE:[-0.5,5.5], YRANGE:[0,10], $
XMINOR:0, XTICKLEN:0.02, YMINOR:0, YTICKLEN:0.02}
p1 = PLOT(loc, h, /STAIRSTEP, LAYOUT=[4,3,1], $
_EXTRA=ex, XTITLE='Plot Stairstep')
p2 = PLOT(loc, h, /HISTOGRAM, LAYOUT=[4,3,2], $
_EXTRA=ex, /CURR,XTITLE='Plot Histogram')
p3 = BARPLOT(loc, h, LAYOUT=[4,3,3], _EXTRA=ex, $
/CURR,XTITLE='Barplot Default')
p4 = BARPLOT(loc, h, LAYOUT=[4,3,4], _EXTRA=ex, $
/CURR, /HISTOGRAM, XTITLE='Barplot Histogram')
ROUTINE_FILEPATH Function
If no argument is given to ROUTINE_FILEPATH, the function will automatically return the full path to the currently-scoped routine. This behavior is useful if you are trying to read a data file from the same directory as your routine and you do not want to hard code the routine name within your code.
Workbench Editor: Automatic Close of Begin/End Blocks
In the IDL Workbench editor, when you press the Enter key at the end of a line containing an IDL "begin" statement, the editor will automatically insert the matching "end" statement. The automatic insertion will work for all IDL block statements: IF/ENDIF, FOREACH/ENDFOREACH, FOR/ENDFOR, ELSE/ENDELSE, WHILE/ENDWHILE, CASE/ENDCASE, SWITCH/ENDSWITCH, and REPEAT/ENDREP. The inserted "end" statement will have the same case (upper, lower, or first-letter capitalization) as the matching word in the "begin" statement.
You can disable this behavior using a preference on the IDL->Editor page in the Preferences Dialog.
Workbench Editor: Automatic Formatting of Pasted Code
In the IDL Workbench editor, when you paste a block of text containing one or more lines, the editor will automatically apply the default indenting and formatting to the pasted code. This behavior is equivalent to pasting the code and then manually choosing the Source->Format menu item.
You can disable this behavior using a preference on the IDL->Editor page in the Preferences Dialog. You can also control the formatting of the pasted text using the IDL->Formatter page in the Preferences.