Vectors are points, multipoints, polylines, or polygons used to mark areas of interest within an image. Use the Vector tools in toolbar to work with vectors.
ENVI supports the following vector file types:
- ENVI vector files (.evf)
- Shapefiles (.shp, excluding Z and M polygons)
- GeoJSON files (.json, .geojson read-only support)
- OGC GeoPackage vector files (.gpkg).
For additional details on vectors, see Vector Records Background.
See Vector Auxiliary Files Background for a list and description of the auxiliary files that ENVI creates on your local drive when opening vector files for the first time.
See the following sections:
Working with Vector Layers
The Layer Manager lists all of the displayed files in a tree view. Vector layers that are open but are not displayed in a view will be listed in the Data Manager.
Each time you open a new vector file, the layer is added to the top of the Layer Manager tree and it becomes the selected layer. The selected layer is what you can perform specific functions on (such as add ROIs), without affecting other layers.
Here are some general tips for working with layers:
- To select a layer, click its name in the Layer Manager.
- Basic metadata for the selected layer (such as Name) displays in the Layer tab, located below the Toolbox.
- To remove a layer from the view, right-click and select Remove. Removing a layer from the Layer Manager tree will remove it from the view, but the file will remain open in the Data Manager.
- To select multiple layers, use Ctrl+click or Shift+click and select the desired layers. To perform actions on the selected layers, right-clicking and select an option from the context menu.
- To hide a single layer in a view, disable the check box for that layer in the Layer Manager. To show the layer, enable the check box.
- To hide selected layers in the view, use Ctrl+click to multi-select the layers to hide, then right-click and select Hide All Layers. To show selected layers that are hidden, use Ctrl+click to multi-select the layers to show, then right-click and select Show All Layers.
- To hide all layers in a view, right-click on the View icon in the Layer Manager and select Hide All Layers. To show all layers, right-click and select Show All Layers.
- If you created multiple views in the Image window, the layers for each view are grouped under View entries.
- If you have multiple views displayed, you can drag-and-drop layers from the Layer Manager to any one of those views in the display or to the corresponding view icons in the Layer Manager. This creates a copy of the layer(s) to populate the views.
- To add a vector layer to a new view, select the filename in the Data Manager, enable the Load in New View check box, and click Load Data.
Create and Save Vector Layers as Shapefiles
Here are some tips for working with vector layers:
- Create a new layer by selecting File > New > Vector Layer from the menu bar to open the Create New Vector Layer dialog.
- Each layer can contain only one Record Type (for example, points).
- The Coordinate System shows the projection information of the current view, and the range of the new vector layer will be the same as what is displayed in that view. If the current view is empty, Coordinate System will default to Geographic WGS-84.
- ENVI performs Real-Time Ortho for vector layers created on top of an RPC image. The vector layers will contain projected coordinates that can display with other projected imagery, and projected vector layers will display on top of an existing RPC image without reprojecting the RPC image.
- When the layer has been modified, the icon next to the layer name in the Layer Manager becomes shaded
 . The shading is removed once the layer is saved.
- Save layer changes by right-clicking in the view and selecting Save.
- Save layer changes to a new file by right-clicking in the Image window and selecting Save As. Also use Save As when saving a new vector layer for the first time.
- Saving the new layer creates a new attribute table, which consists of the numeric attribute RECORD_ID.
- To rename a layer, right-click its name and select Rename Item. Enter the new name in the Rename Item dialog and press the Enter key to accept it or press the Esc key to cancel. (Linux and Mac users should click the green check icon to accept the new name or click the red X icon to cancel.)
Create Vector Layers from ASCII Data as Shapefiles
You can create point, multi-point, polyline, or polygon vector layers from ASCII text files or comma-separated value (CSV) files that contain data and geolocation values. An example is creating a point-based shapefile from an ASCII file that contains GPS records. You can only create new vector layers from ASCII data; you cannot add records to an existing vector layer.
You can write a script to create vector layers from ASCII data using the ASCIIToVector task.
If the data contain a combination of numeric and text values, they must be separated by commas. If the data consist entirely of numeric values, they can be separated by spaces or commas. You can add records to a new or existing ROI. ENVI will ignore any header information or column labels.
Tip: The ENVI Feature Counting Tool provides an option to export feature counts to CSV files or ASCII reports.
Follow these steps:
- Create a new layer by selecting File > New > Vector Layer from the menu bar. The Create New Vector Layer dialog appears.
- Enter an optional Layer Name.
- From the Record Type drop-down list, select the type of vector record to create. The choices are Point, Multipoint, Polyline, or Polygon (default).
- Click OK.
- Select the vector layer in the Layer Manager to make it the active layer. The Create Vector tool becomes active in the ENVI toolbar.
- Right-click in the Image window and select Import from ASCII. The Select Input Coordinates File dialog appears.
- Select an ASCII text file (.txt) or CSV file (.csv) with the records you want to import and click Open. The Import from ASCII dialog appears.
The File Preview section shows the columns of data that were imported; for example:
- In the X field of Data Columns, select the column number that contains longitudes or eastings.
- In the Y field of Data Columns, select the column number that contains latitudes or northings.
Using the example above, the X field is column #3 since that column contains longitudes. The Y field is column #2 since that column contains latitudes:
- Select the Coordinate System of the imported ASCII data. See Select Coordinate Systems for further instructions. The default is Geographic Lat/Lon WGS-84.
- Click OK.
Add Vectors
You can add vectors to shapefiles and EVFs only.
- In the active layer, click the Vectors drop-down on the toolbar and select Vector Create, then click on the image where you want to add the vector.
- Create polygons or polylines by clicking and dragging to draw them, or click at intervals to add vertices one at a time.
- Use the right-click menu options to accept vectors when they are drawn.
- Multipoint vectors can be added only to a vector file that is designated a multipoint file.
- Group or ungroup vectors by selecting them and using the right-click menu options.
- Editing a vector layer with an associated attribute table does not change the existing attribute values. Depending on the type of edits you make, this may mean the values in that record are no longer valid.
Edit or Delete Vectors
You can edit or delete vectors in shapefiles and EVFs only. The options include: delete a record, move a polyline or polygon vertex, add or delete a polyline or polygon vertex, group or ungroup records. join polylines, merge or split polylines or polygons, smooth polygons, rectangulate polygons. and remove polygon holes.
- To edit or delete polygon or polyline records in the active layer, click the Vectors drop-down on the toolbar and select Vector Edit.
- To edit or delete points in the active layer, click the Vectors drop-down on the toolbar and select Vertex Edit.
- Select a record by clicking on it.
- Select multiple records by using Ctrl+click, or by clicking and dragging to draw a box around the records.
- Use the right-click menu to choose edit or delete options for the selected record(s).
Change Properties for Vectors
Changing properties works for all supported vector types. The properties of a vector layer are displayed below the ENVI Toolbox; for example:
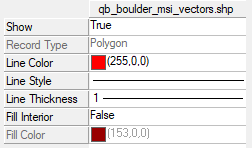
You can edit the basic properties directly in this panel.
To edit the display properties for a given attribute, right-click on a vector layer in the Layer Manager and select Properties. In the Vector Properties dialog, select an Attribute name from the drop-down list. The Attribute Values area in the Vector Properties dialog lists the unique values for that attribute. Make you changes, then click Apply to commit them.
Below are some tips for using the Vector Properties dialog:
Attribute Values
To edit the display properties of a specific attribute value, select the value in the Attribute Values list. Use the table at the bottom of the dialog to edit the color properties for that value.
Here are some tips for working with vector files that have more than 256 unique attribute values:
Vector Symbology
Vector symbology is supported for shapefiles and GeoJSON files. Once you have modified the display properties of a vector layer, you can save the symbology settings for later use. From the Symbology drop-down list and select Save/Update Symbology File. ENVI saves the symbology to a .evs file with the same root name as the vector file. By default, the symbology file is written to the same directory as the vector file. However, when that directory is read-only, the symbology file is written to the Auxiliary File Directory.
Each time you reopen the vector file, ENVI applies the styles defined in the associated symbology file (if it is present). You can select Save/Update Symbology File after making further changes. Or, if you do not like the changes you have made, select Apply Default Symbology to revert back to the styles defined in the symbology file.
To delete the symbology file, select Delete Symbology File. The vector layer then uses ENVI's default colors and styles.
Filter by Attributes
Filtering by attributes works for all supported vector types. If a vector layer has an associated attribute table, you can filter the records by one or more attributes. Right-click the layer name in the Layer Manager and select Filter Records by Attributes to open the Filter by Attributes dialog.
View Vector Attributes and Metadata
Viewing attributes works for all supported vector types. If a vector layer has an associated attribute table, you can open and view the attributes. Right-click on the layer name in the Layer Manager and select View Attributes to open the Attribute Viewer.
You can also view the metadata associated with the vectors. Right-click on the layer name in the Layer Manager and select View Metadata to open the View Metadata dialog.
Zoom Options
Zoom options work for all supported vector types.
- To zoom to the full extent of a given vector layer, right-click on the layer name in the Layer Manager and select Zoom to Layer Extent.
- Select Full Extent from the Zoom drop-down menu or click the Zoom to Full Extent button
 in the toolbar zooms in to the combined extents of all layers for the current view.
- If a vector layer is georeferenced, the Zoom To drop-down list in the main toolbar displays options for Map Scale: